TracCloudReportsManagement13: Difference between revisions
From Redrock Wiki
No edit summary |
No edit summary |
||
| Line 1: | Line 1: | ||
{{TracCloudReportTabs}} | {{TracCloudReportTabs}} | ||
<div class="tcWidgetPage"> | |||
<div class="categoryWide"> | <div class="categoryWide"> | ||
{{TracCloudReportsManagementTOC}} | {{TracCloudReportsManagementTOC}} | ||
| Line 39: | Line 40: | ||
[[Category:TracCloud]] | [[Category:TracCloud]] | ||
</div> | |||
Revision as of 12:05, 15 November 2023
Management
• Appointment Slot Utilization Date Comparison
• Appointments/Availabilities by Hour by Day of Week
• Appointments/Visits Utilization
• Consultant Max Hours and Non-Duplicated Appointment Time
• Consultant Non-Duplicated Visit Time
• Logins by Hour by Day of Week
• Optional: In-Person vs Online Appointments
• Outstanding Appointment Requests
• Students Visits Cleanup Data
• Visits by Faculty and Subject
• Visits by Assigned Advisor and Student
Usage Snapshot
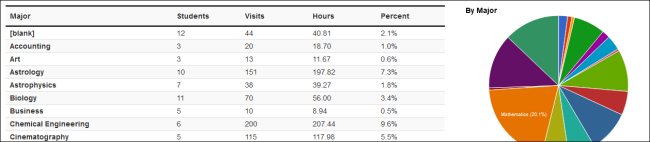
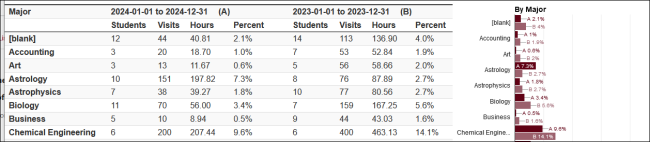
This report provides a snapshot of your recent visits by different fields. Each field added will display the name of the fields, number of students, total visits, total hours, and a pie-chart for the data within the specified range. You can also generate this report as a Date Comparison, allowing you to view two columns of snapshot data for different date ranges.
- Centers
- Filter report data by center. You can select all centers or only a specific few to narrow down your results. At least one center must be selected.
- Time Frame
- The date range for the data in this report. Beyond entering a date range manually, you can also choose a preset date range (Today, This Month, This Semester, etc) from the dropdown list above.
- Secondary Time Frame
- An additional date range for data comparison.
- Chart Type
- This allows you to select the format of the chart. Pie, bar, or line.
- In-Person/Online
- Filter the data in this report to only include In-Person or Online records. Defaults to All.
- Show online locations specifically
- If unchecked, the 'Location' for online Appts/Visits will be displayed as simply 'Online.' If this option is checked, it will display the specific online location (e.g., 'https://zoom.us/123456789').
- Additional Search
- Filter your results by a selected field.
Use * as a wildcard (Subject: MAT*)
| as "or" (Major: Mathematics|Biology)
# as "Not" (Status: #Inactive)
&& as "And" (Major: #Mathematics&&#Biology)
blankornull as a keyword to find records where the field is blank (Reason: blankornull)
Multiple fields can be added to further narrow down your results.
- Filter your results by a selected field.
- Snapshot Fields
- Use this to add fields to your report. Add Location to see location usage, consultants to see who has met with the most students, etc.
- Output format
- Use HTML to view report data in your browser, or export this report to a CSV file (available for most reports). Some reports offer additional CSV options depending on if you want to include totals and/or data grouping in your export.
- Deliver to
- Display this report immediately in your browser ("Screen"), or send the report to a specified email address ("Email"). Multiple email addresses can be specified, use ; to separate them (example@example.edu;sample@example.edu).
- Report Option
- Usage Snapshot will display visit data for all Snapshot Fields in the date range specified and includes a pie chart view for each field.
- Date Comparison does the same, but for both of your selected date ranges, allowing you to compare attendance from two periods in a single report. Keep in mind that certain fields can change for students over time, and all reports (including this one) will only show the current state of these records. This report option should be used on static/unchanging fields like the visit's subject, center, or reason, and not on fields like the student's class or GPA as those may have changed since the date of their visits.
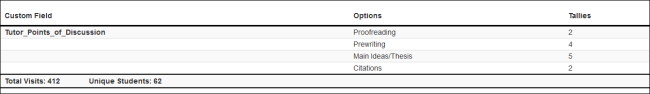
- Custom Field Multi-Check Tally will provide the total times each multi-check custom field from a visit record was checked, as opposed to the total times every combination of options was chosen (i.e., counting instances of A, B, and C individually rather than A, A + B, A + C, A + B + C, B, etc).


HTML

CSV
