TracCloud Report: Usage Snapshot: Difference between revisions
From Redrock Wiki
No edit summary |
No edit summary |
||
| Line 8: | Line 8: | ||
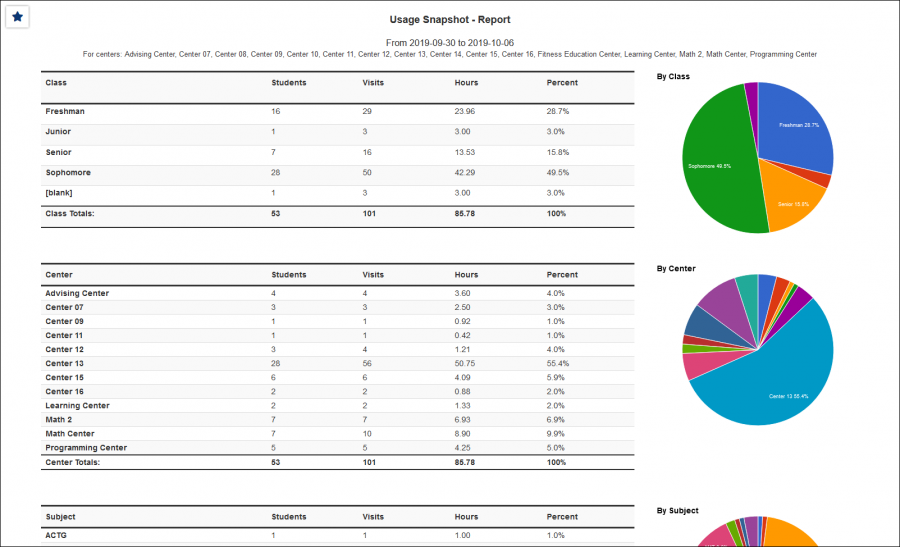
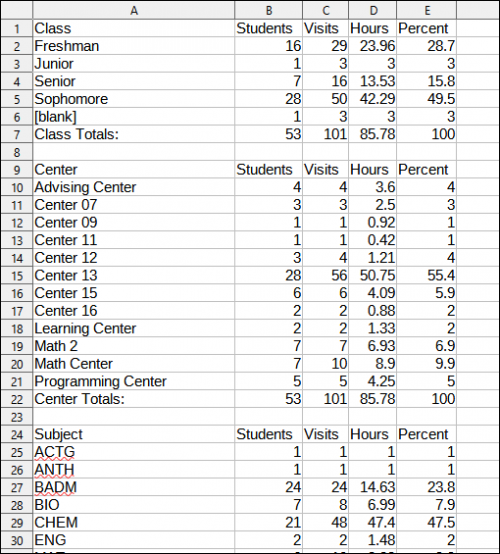
This report provides a snapshot of your recent visits by different fields. Each field added will display the name of the fields, number of students, total visits, total hours, and a pie-chart for the data within the specified range. You can also generate this report as a <i>Date Comparison</i>, allowing you to view two columns of snapshot data for different date ranges.<br><br> | This report provides a snapshot of your recent visits by different fields. Each field added will display the name of the fields, number of students, total visits, total hours, and a pie-chart for the data within the specified range. You can also generate this report as a <i>Date Comparison</i>, allowing you to view two columns of snapshot data for different date ranges.<br><br> | ||
[[File: | [[File:2614206.png|600px]]<br> | ||
{{#lst:Template:TracCloudReportsDescriptions|Centers}} | {{#lst:Template:TracCloudReportsDescriptions|Centers}} | ||
| Line 15: | Line 15: | ||
{{#lst:Template:TracCloudReportsDescriptions|SecondTimeFrame}} | {{#lst:Template:TracCloudReportsDescriptions|SecondTimeFrame}} | ||
{{#lst:Template:TracCloudReportsDescriptions|ChartType}} | |||
{{#lst:Template:TracCloudReportsDescriptions|InPersonOnline}} | {{#lst:Template:TracCloudReportsDescriptions|InPersonOnline}} | ||
Revision as of 09:56, 31 July 2023
Management• Consultant Non-Duplicated Visit Time • Logins by Hour by Day of Week • Students Visits Cleanup Data
|
Usage Snapshot This report provides a snapshot of your recent visits by different fields. Each field added will display the name of the fields, number of students, total visits, total hours, and a pie-chart for the data within the specified range. You can also generate this report as a Date Comparison, allowing you to view two columns of snapshot data for different date ranges.
|


