TracCloud Report: Logins by Hour by Day of Week
From Redrock Wiki
Management
• Appointments by Assigned Advisor and Student
• Consultant Non-Duplicated Visit Time
• Logins by Hour by Day of Week
• Students Visits Cleanup Data
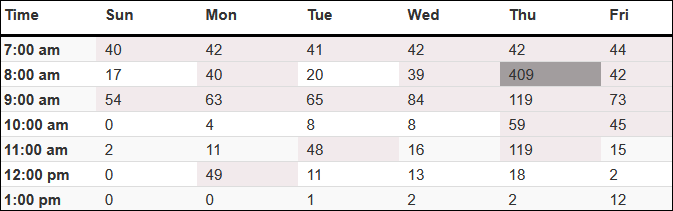
Logins by Hour by Day of Week
This report illustrates the time of day that students logged into the center over a given date range. The report is plotted by number in a grid with hours of the day listed vertically on the left and days of the week horizontally on the top.
Each visit is only counted once even if it spans multiple hours. For example, a visit from 9:30am to 10:30am will count for 1 in the 9:00am row and 0 in the 10:00am row. If you're interested in counting visits across multiple hours, consider using the Attendance by Hour report instead.

- Centers
- Filter report data by center. You can select all centers or only a specific few to narrow down your results. At least one center must be selected. Inactive centers are hidden from this list by default, but can be included by checking "Show Inactive."
- Time Frame
- The date range for the data in this report. Beyond entering a date range manually, you can also choose a preset date range (Today, This Month, This Semester, etc) from the dropdown list above.
- Increment
- Select your preferred time increment. I.e., separate results in increments of 1 hour, 30 minutes, or 15 minutes.
- Meeting Type
- Filter the data in this report to only include records based on meeting type (In-Person, Online, Asynchronous (where applicable), and Phone). Defaults to All.
- Highlight Busier Times
- If enabled, times of day that are busier than usual will be highlighted. TracCloud can automatically calculate the threshold for "busier," or you can specify your own threshold after this option is enabled.

- Additional Search
- Filter your results by a selected field.
Use * as a wildcard (Subject: MAT*)
| as "or" (Major: Mathematics|Biology)
# as "Not" (Status: #Inactive)
&& as "And" (Major: #Mathematics&&#Biology)
blankornull as a keyword to find records where the field is blank (Reason: blankornull)
Multiple fields can be added to further narrow down your results.
- Filter your results by a selected field.
- Output format
- Use HTML to view report data in your browser, or export this report to a CSV file (available for most reports). Some reports offer additional CSV options depending on if you want to include totals and/or data grouping in your export.
- Deliver to
- Display this report immediately in your browser ("Screen"), or send the report to a specified email address ("Email"). Multiple email addresses can be specified, use ; to separate them (example@example.edu;sample@example.edu).
HTML

CSV
