TracCloud Report: Usage Snapshot
From Redrock Wiki
Usage Snapshot
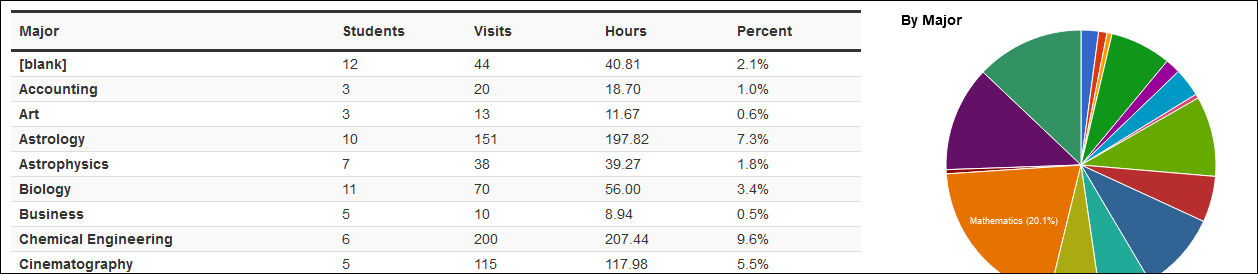
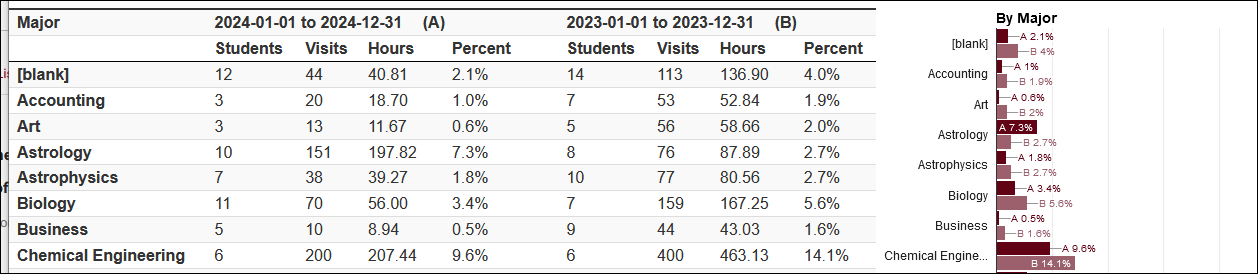
This report provides a snapshot of your recent visits by different fields. Each field added will display the name of the fields, number of students, total visits, total hours, and a pie-chart for the data within the specified range. You can also generate this report as a Date Comparison, allowing you to view two columns of snapshot data for different date ranges.

- Centers
- Filter report data by center. You can select all centers or only a specific few to narrow down your results. At least one center must be selected. Inactive centers are hidden from this list by default, but can be included by checking "Show Inactive."
- Report Option
- Usage Snapshot will display visit data for all Snapshot Fields in the date range specified and includes a pie chart view for each field.
- Date Comparison does the same, but for both of your selected date ranges, allowing you to compare attendance from two periods in a single report. Keep in mind that certain fields can change for students over time, and all reports (including this one) will only show the current state of these records. This report option should be used on static/unchanging fields like the visit's subject, center, or reason, and not on fields like the student's class or GPA as those may have changed since the date of their visits.
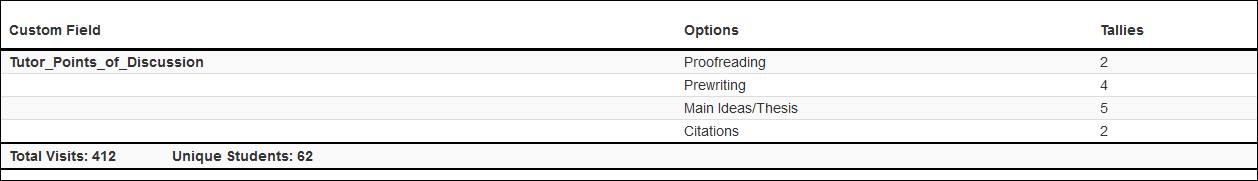
- Custom Field Multi-Check Tally will provide the total times each multi-check custom field from a visit record was checked, as opposed to the total times every combination of options was chosen (i.e., counting instances of A, B, and C individually rather than A, A + B, A + C, A + B + C, B, etc).


- Time Frame
- The date range for the data in this report. Beyond entering a date range manually, you can also choose a preset date range (Today, This Month, This Semester, etc) from the dropdown list above.
- Secondary Time Frame
- An additional date range for data comparison.
- Sort by
- Choose how the selected data is sorted.
- Chart by
- Choose how the selected data is sorted in charts.
- Chart Type
- This allows you to select the format of the chart. Pie, bar, or line.
- Meeting Type
- Filter the data in this report to only include records based on meeting type (In-Person, Online, Asynchronous (where applicable), and Phone). Defaults to All.
- Show online locations specifically
- If unchecked, the 'Location' for online Appts/Visits will be displayed as simply 'Online.' If this option is checked, it will display the specific online location (e.g., 'https://zoom.us/123456789').
- Use Student Historical Data
- If unchecked, fields such as Major, Class, GPA, etc will be shown as they are right now. If checked, they will be shown as they were in the date range you selected. This can be useful for retroactively running reports on prior semesters even if those fields have since been overwritten with later data. Keep in mind this feature was implemented in May of 2025, older data may not be available.
- Additional Search
- Filter your results by a selected field.
Use * as a wildcard (Subject: MAT*)
| as "or" (Major: Mathematics|Biology)
# as "Not" (Status: #Inactive)
&& as "And" (Major: #Mathematics&&#Biology)
blankornull as a keyword to find records where the field is blank (Reason: blankornull)
Multiple fields can be added to further narrow down your results.
- Filter your results by a selected field.
- Snapshot Fields
- Use this to add fields to your report. Add Location to see location usage, consultants to see who has met with the most students, etc.
- Output format
- Use HTML to view report data in your browser, or export this report to a CSV file (available for most reports). Some reports offer additional CSV options depending on if you want to include totals and/or data grouping in your export.
- Deliver to
- Display this report immediately in your browser ("Screen"), or send the report to a specified email address ("Email"). Multiple email addresses can be specified, use ; to separate them ([email protected];[email protected]).
Filtering by Fields
A unique feature of this report is the ability to filter fields from the results screen. Hover over a field and you can choose to either filter to only records with that value or to exclude records with that value. This applies to all fields in the report, so for example, you could see a breakdown of attendance by Center for students assigned to Major X and Class Y.

After applying filters, you can scroll up to the top of your report screen to reset your filters or click "List Students" to be taken to the students listing to see which students relate to the records you're currently viewing.

HTML

CSV
