TracCloud Report: Success Plans: Difference between revisions
From Redrock Wiki
Created page with "{{TracCloudReportTabs}} {| style="width:100%; vertical-align:top; " | style="width:250px; vertical-align:top; padding:2px 15px 2px 2px;" | {{TracCloudReportsModulesTOC}} | sty..." |
No edit summary |
||
| Line 8: | Line 8: | ||
The <b>Success Plans</b> report allows you to view a list of student Success Plans, along with their status, completion percentage, additional student information, and more. | The <b>Success Plans</b> report allows you to view a list of student Success Plans, along with their status, completion percentage, additional student information, and more. | ||
[[File: | [[File:9824119.png|600px]]<br><br> | ||
| Line 20: | Line 20: | ||
{{#lst:Template:TracCloudReportsDescriptions|SuccessPlan_Faculty}} | {{#lst:Template:TracCloudReportsDescriptions|SuccessPlan_Faculty}} | ||
{{#lst:Template:TracCloudReportsDescriptions|SuccessPlan_StepDetails}} | |||
{{#lst:Template:TracCloudReportsDescriptions|AdditionalSearch}} | {{#lst:Template:TracCloudReportsDescriptions|AdditionalSearch}} | ||
| Line 32: | Line 34: | ||
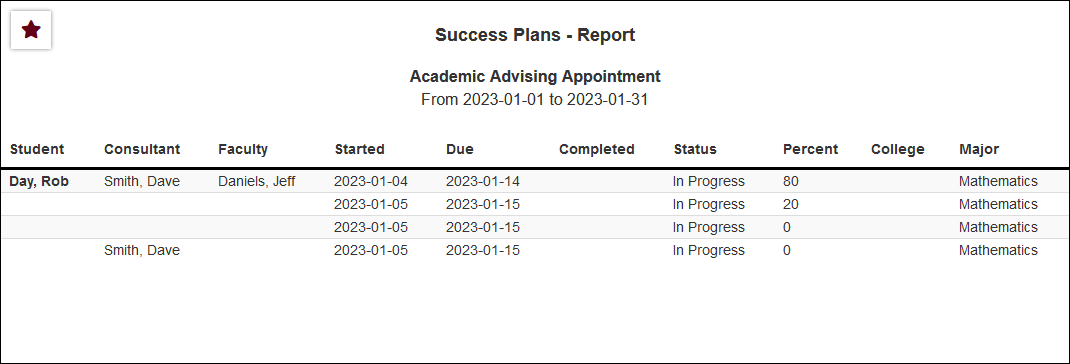
<b><big>HTML</b></big><br> | <b><big>HTML</b></big><br> | ||
[[File:6169128.png|900px]] | [[File:6169128.png|900px]] | ||
<br><br> | |||
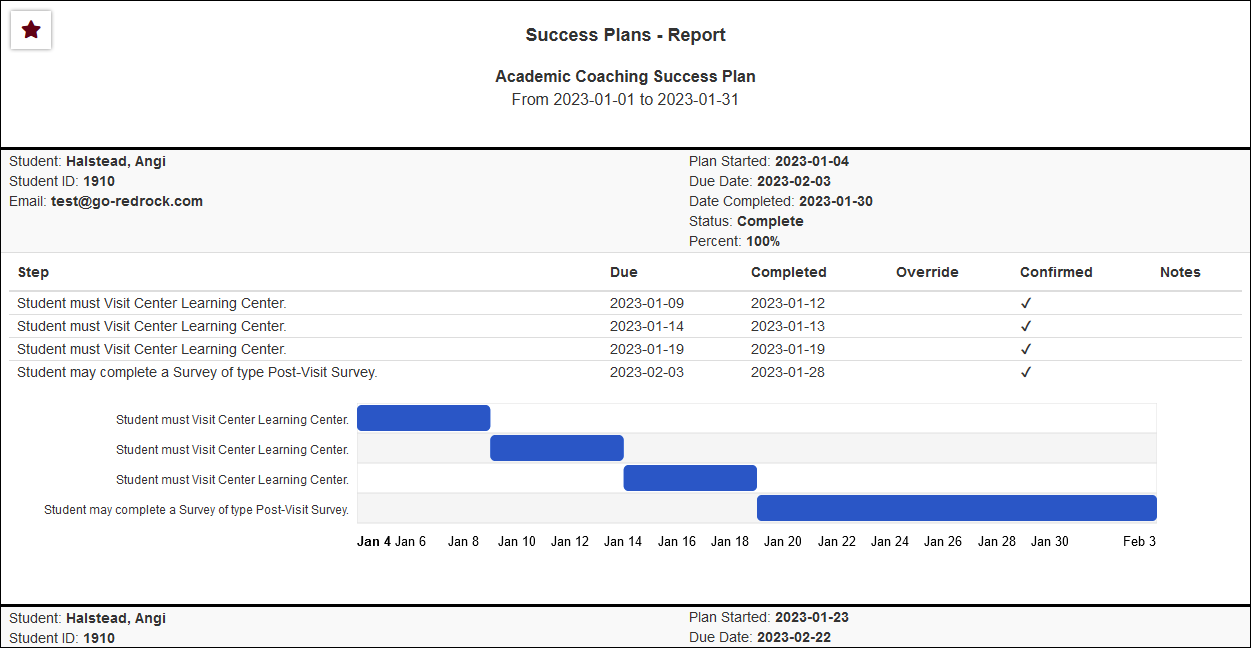
<b><big>HTML (Show Step Details)</b></big><br> | |||
[[File:4266481.png|900px]] | |||
<br><br> | <br><br> | ||
<b><big>CSV</b></big><br> | <b><big>CSV</b></big><br> | ||
Revision as of 23:46, 30 January 2023
Career CenterQ2 TablesRetentionSAGE• Referrals by Student and Appointments/Visits SurveyTrac• Survey Response Rate Comparison • Unanswered Staff/Faculty Surveys Success PlansWork PlansWorkshops
|
Success Plans The Success Plans report allows you to view a list of student Success Plans, along with their status, completion percentage, additional student information, and more.
HTML
|


