TracCloud Report: Referrals by Student and Appointments/Visits: Difference between revisions
From Redrock Wiki
No edit summary |
No edit summary |
||
| Line 1: | Line 1: | ||
{{TracCloudReportTabs}} | {{TracCloudReportTabs}} | ||
<div class="tcWidgetPage"> | <div class="tcWidgetPage"> | ||
<div class=" | <div class="categoryExtraWide"> | ||
{{TracCloudReportsModulesTOC}} | {{TracCloudReportsModulesTOC}} | ||
</div> | </div> | ||
Revision as of 23:52, 12 December 2023
Career Center
Q2 Tables
Retention
SAGE
• Referrals by Student and Appointments/Visits
SurveyTrac
• Survey Response Rate Comparison
• Unanswered Staff/Faculty Surveys
Success Plans
Work Plans
Workshops
Referrals by Student and Appointments/Visits
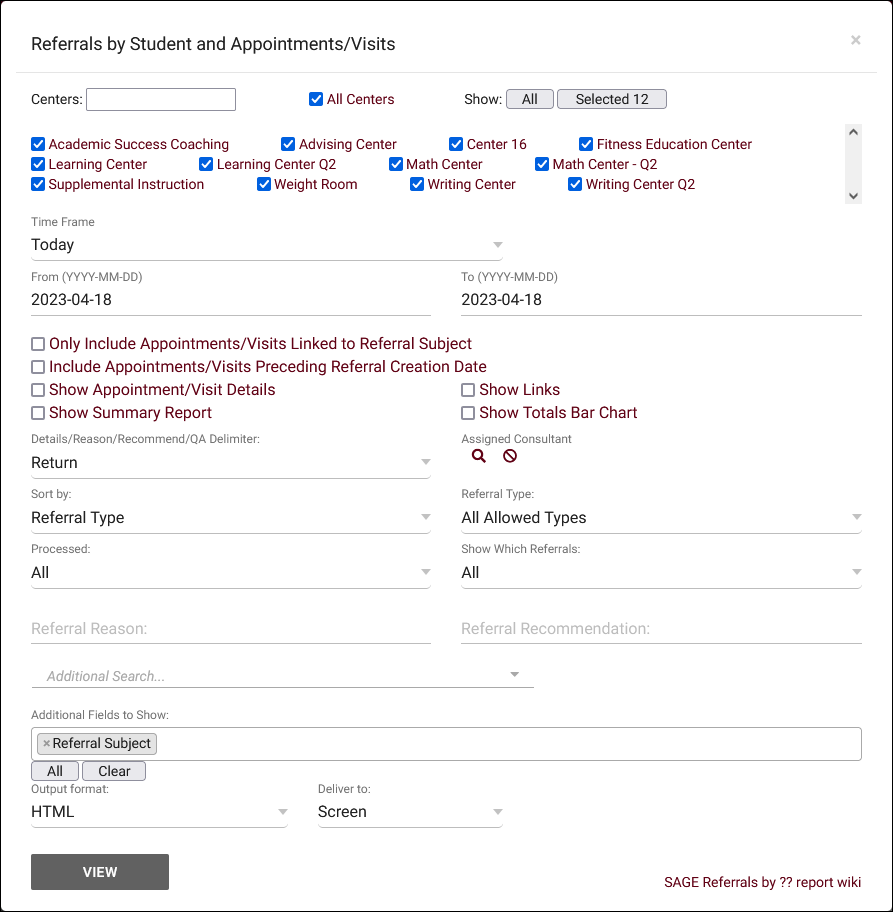
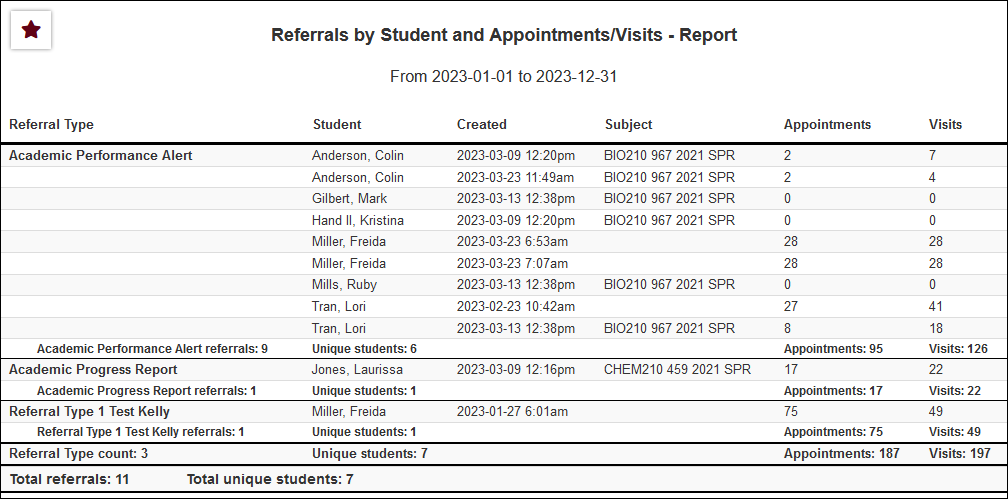
This report displays student referral information, similar to Referrals by ??, but additionally shows information for related visits and appointments. Additional details on those records can also be displayed, along with links to the visit/appointment records for ease of access if Show Links is enabled.
- Centers
- Filter report data by center. You can select all centers or only a specific few to narrow down your results. At least one center must be selected. Inactive centers are hidden from this list by default, but can be included by checking "Show Inactive."
- Time Frame
- The date range for the data in this report. Beyond entering a date range manually, you can also choose a preset date range (Today, This Month, This Semester, etc) from the dropdown list above.
- Only Include Appointments/Visits Linked to Referral Subject
- If checked, only visits/appointments for the same section as the referral will be included in the report results.
- Include Appointments/Visits Preceding Referral Creation Date
- By default, the visits/appointments shown will only be those that take place after the creation of the referral. If this option is checked, older records will also be included.
- Show Appointment/Visit Details
- If checked, the Dates/Times, Statuses, Consultants, and Centers of the appointments and visits will be included in the results.
- Show Summary
- Only show data totals, excluding details of individual records.
- Show Links
- This enables a clickable hyperlink in the report to immediately open visit/appointment records. This only applies when running the report as HTML.
- Show Totals Bar Chart
- Adds a visual bar chart of totals to your report data.
- Details/Reason/Recommend/QA Delimiter
- This allows you to choose how appointments and visits are delimited/separated. E.g., Comma delimited, Pipe delimited, etc.
- Assigned Consultant
- Filter referrals based on the assigned consultant/advisor.
- Sort by
- Choose how the selected data is sorted.
- Referral Type
- Only show referrals of a specific type.
- Processed
- Filter referrals based on status, Processed or Not Processed. Defaults to 'All.'
- Show Which Referrals
- Filter results to only show referrals with visits/appointments, or without. Default is all.
- Referral Reason, Recommendation
- Filter referrals by the selected Reason and/or Recommendation.
- Additional Search
- Filter your results by a selected field.
Use * as a wildcard (Subject: MAT*)
| as "or" (Major: Mathematics|Biology)
# as "Not" (Status: #Inactive)
&& as "And" (Major: #Mathematics&&#Biology)
blankornull as a keyword to find records where the field is blank (Reason: blankornull)
Multiple fields can be added to further narrow down your results.
- Filter your results by a selected field.
- Additional fields to show
- This can be used to add additional data fields to the report results. For example, you could use this to add a student's email address in a visit report.
- Output format
- Use HTML to view report data in your browser, or export this report to a CSV file (available for most reports). Some reports offer additional CSV options depending on if you want to include totals and/or data grouping in your export.
- Deliver to
- Display this report immediately in your browser ("Screen"), or send the report to a specified email address ("Email"). Multiple email addresses can be specified, use ; to separate them (example@example.edu;sample@example.edu).


