TracCloud Report: Survey Snapshot: Difference between revisions
From Redrock Wiki
No edit summary |
No edit summary |
||
| (10 intermediate revisions by the same user not shown) | |||
| Line 1: | Line 1: | ||
{{TracCloudReportTabs}} | {{TracCloudReportTabs}} | ||
<div class="tcWidgetPage"> | |||
<div class="categoryExtraWide"> | |||
{{TracCloudReportsModulesTOC}} | |||
</div> | |||
<div class="pageTitle">Survey Snapshot</div> | |||
<onlyinclude> | |||
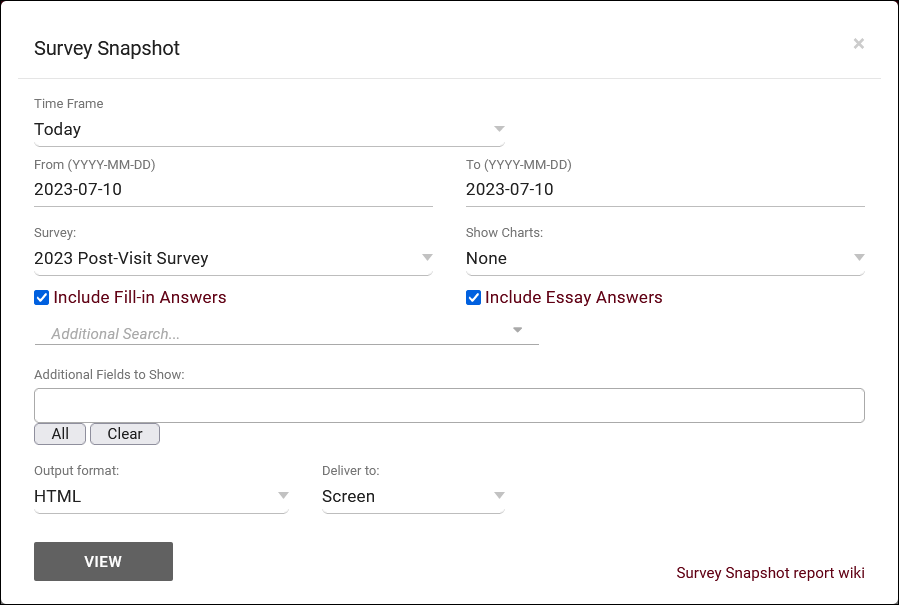
This report allows you to export the response data for any of your SurveyTrac surveys in a Snapshot format, providing the total number of answers for each question.<br> | |||
[[File:3053086.png|600px]]<br> | |||
{{#lst:Template:TracCloudReportsDescriptions|TimeFrame}} | |||
{{#lst:Template:TracCloudReportsDescriptions|Survey_SurveyReport}} | |||
{{#lst:Template:TracCloudReportsDescriptions|Surveys_ShowCharts}} | |||
{{#lst:Template:TracCloudReportsDescriptions|IncludeFillInEssay_SurveyReports}} | |||
{{#lst:Template:TracCloudReportsDescriptions|AdditionalSearch}} | |||
{{#lst:Template:TracCloudReportsDescriptions|AdditionalFieldsToShow}} | |||
{{#lst:Template:TracCloudReportsDescriptions|OutputFormat}} | |||
{{#lst:Template:TracCloudReportsDescriptions|DeliverTo}} | |||
<hr> | <hr> | ||
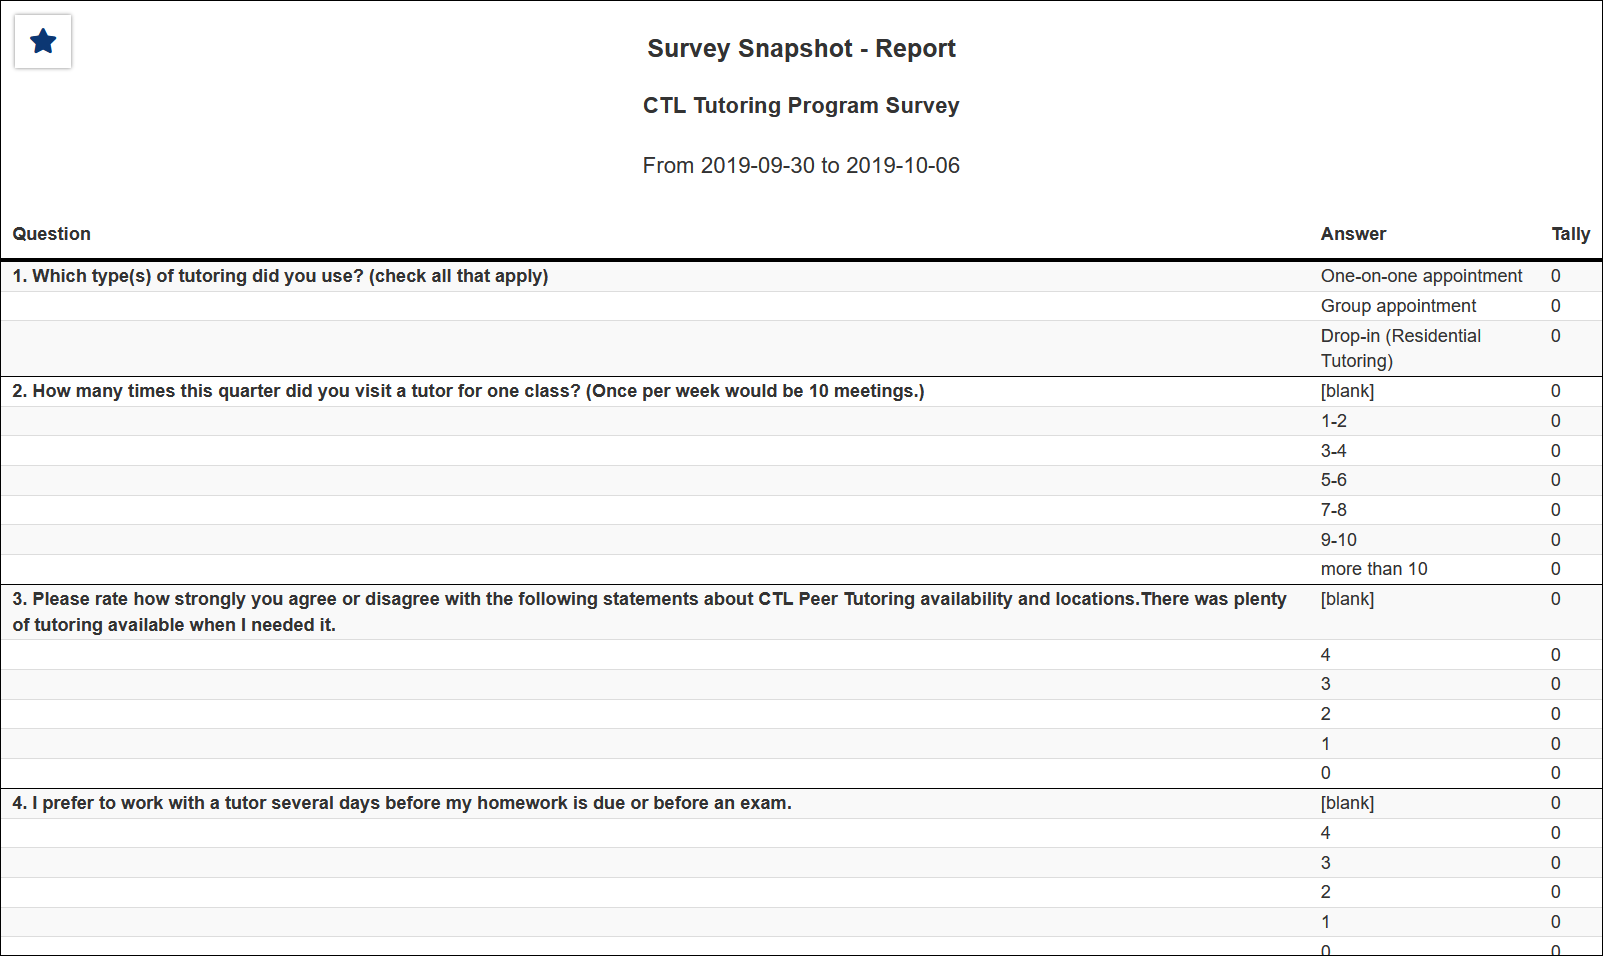
<b><big> | <b><big>HTML</b></big><br> | ||
< | [[File:6472269.png|900px]] | ||
<br><br> | |||
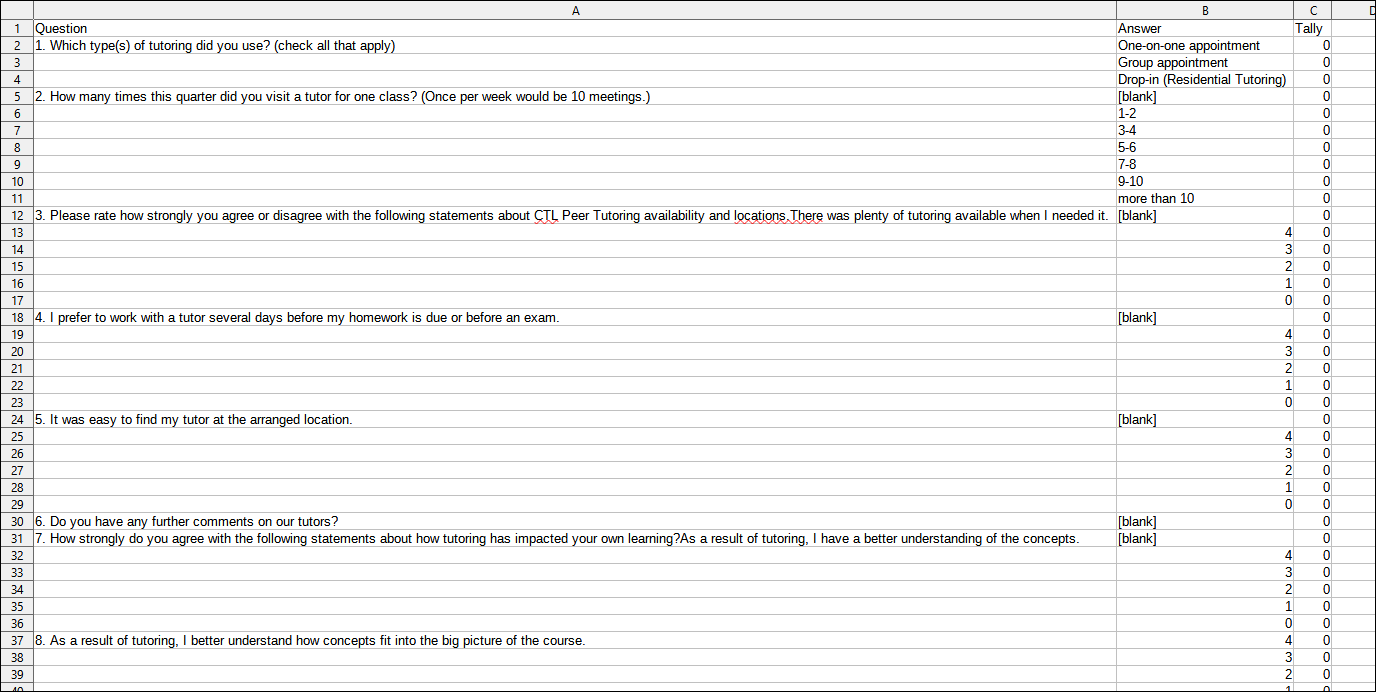
<b><big>CSV</b></big><br> | |||
[[File:1363212.png|900px]] | [[File:1363212.png|900px]] | ||
</onlyinclude> | |||
[[Category:TracCloud Reports]] | |||
</div> | |||
Latest revision as of 17:04, 29 July 2025
Career Center
Q2 Tables
Retention
SAGE
• Referrals by Student and Appointments/Visits
SurveyTrac
• Survey Response Rate Comparison
• Unanswered Staff/Faculty Surveys
Success Plans
Work Plans
Workshops
Survey Snapshot
This report allows you to export the response data for any of your SurveyTrac surveys in a Snapshot format, providing the total number of answers for each question.
- Time Frame
- The date range for the data in this report. Beyond entering a date range manually, you can also choose a preset date range (Today, This Month, This Semester, etc) from the dropdown list above.
- Survey
- Export responses from this selected survey.
- Show Charts
- This field allows you to add charts to the report results. Pie, bar, or line.
- Include Fill-in & Essay Answers
- These options will include the answers that were written manually during the response process (as opposed to checkbox/multiple-choice answers).
- Additional Search
- Filter your results by a selected field.
Use * as a wildcard (Subject: MAT*)
| as "or" (Major: Mathematics|Biology)
# as "Not" (Status: #Inactive)
&& as "And" (Major: #Mathematics&&#Biology)
blankornull as a keyword to find records where the field is blank (Reason: blankornull)
Multiple fields can be added to further narrow down your results.
- Filter your results by a selected field.
- Additional fields to show
- This can be used to add additional data fields to the report results. For example, you could use this to add a student's email address in a visit report.
- Output format
- Use HTML to view report data in your browser, or export this report to a CSV file (available for most reports). Some reports offer additional CSV options depending on if you want to include totals and/or data grouping in your export.
- Deliver to
- Display this report immediately in your browser ("Screen"), or send the report to a specified email address ("Email"). Multiple email addresses can be specified, use ; to separate them (example@example.edu;sample@example.edu).


