|
|
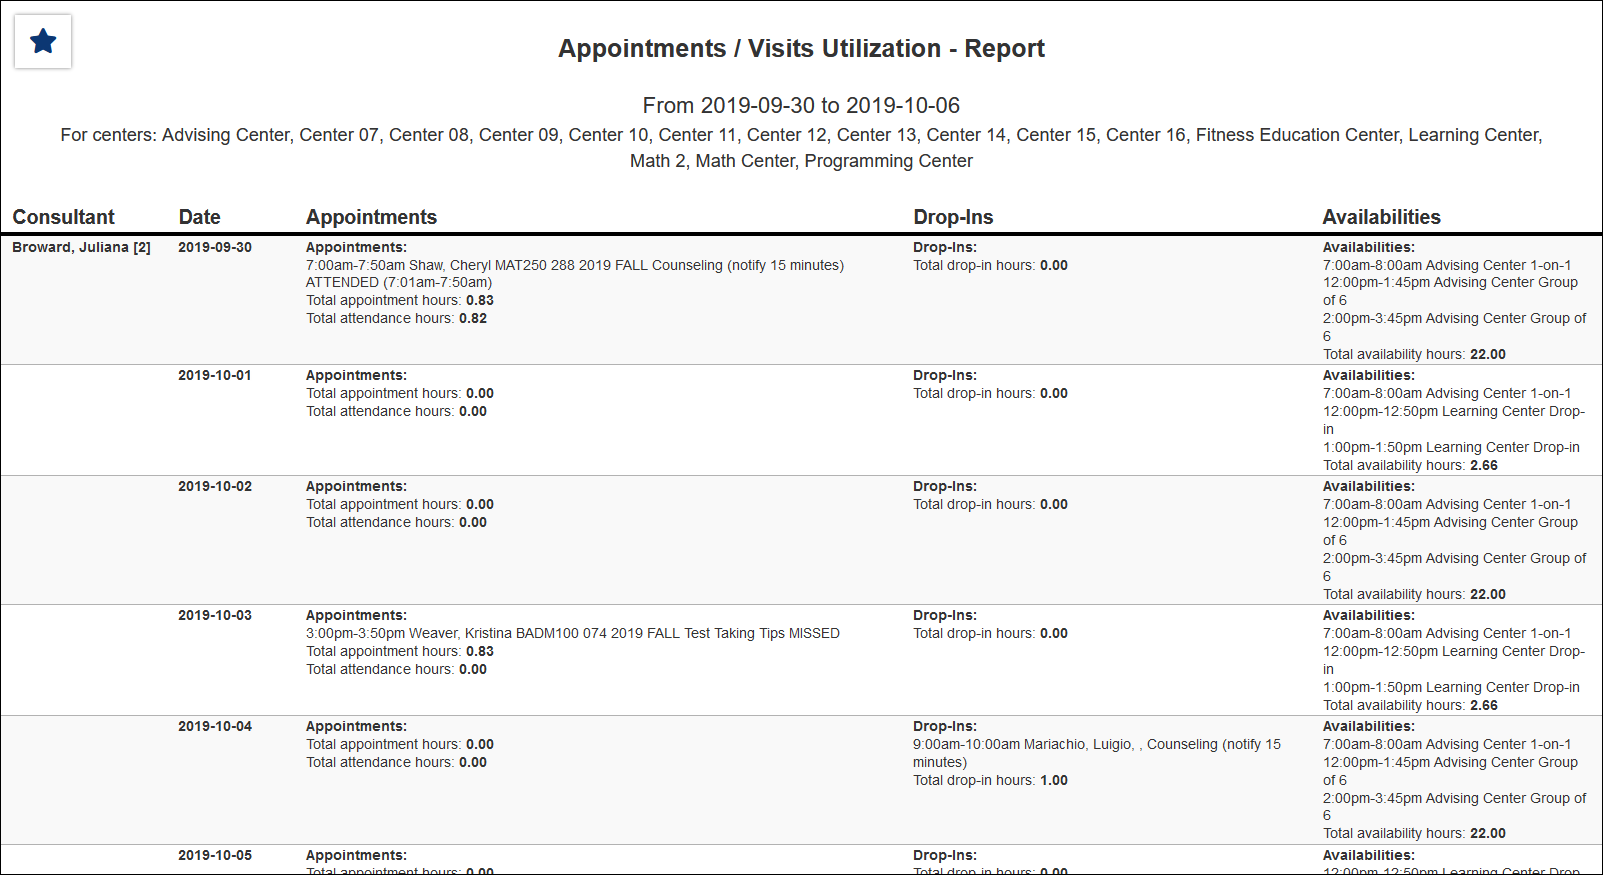
Appointments/Visits Utilization
This report shows the appointment utilization and visits. Who the consultant was, date, appointment, if there were drop-in hours and the remaining availability.
File:4565924.png
- Filter report data by center. You can select all centers or only a specific few to narrow down your results. At least one center must be selected. Inactive centers are hidden from this list by default, but can be included by checking "Show Inactive."
- The date range for the data in this report. Beyond entering a date range manually, you can also choose a preset date range (Today, This Month, This Semester, etc) from the dropdown list above.
- Show Canceled Appointments
- Include appointments that have been canceled in your report results.
- Include availability times in the report results.
- Include blocked or reserved schedule time in the report results.
- Only show data totals, excluding details of individual records.
- Include consultant work visits in report results.
- Include data totals in report results.
- Adds a visual bar chart of totals to your report data.
- Filter your results by a selected field.
Use * as a wildcard (Subject: MAT*)
| as "or" (Major: Mathematics|Biology)
# as "Not" (Status: #Inactive)
&& as "And" (Major: #Mathematics&&#Biology)
blankornull as a keyword to find records where the field is blank (Reason: blankornull)
Multiple fields can be added to further narrow down your results.
- Use HTML to view report data in your browser, or export this report to a CSV file (available for most reports). Some reports offer additional CSV options depending on if you want to include totals and/or data grouping in your export.
- Display this report immediately in your browser ("Screen"), or send the report to a specified email address ("Email"). Multiple email addresses can be specified, use ; to separate them ([email protected];[email protected]).
|
