TracCloud Report: Usage Snapshot
From Redrock Wiki
Management• Appointments by Assigned Advisor and Student • Consultant Non-Duplicated Visit Time • Logins by Hour by Day of Week • Students Visits Cleanup Data
|
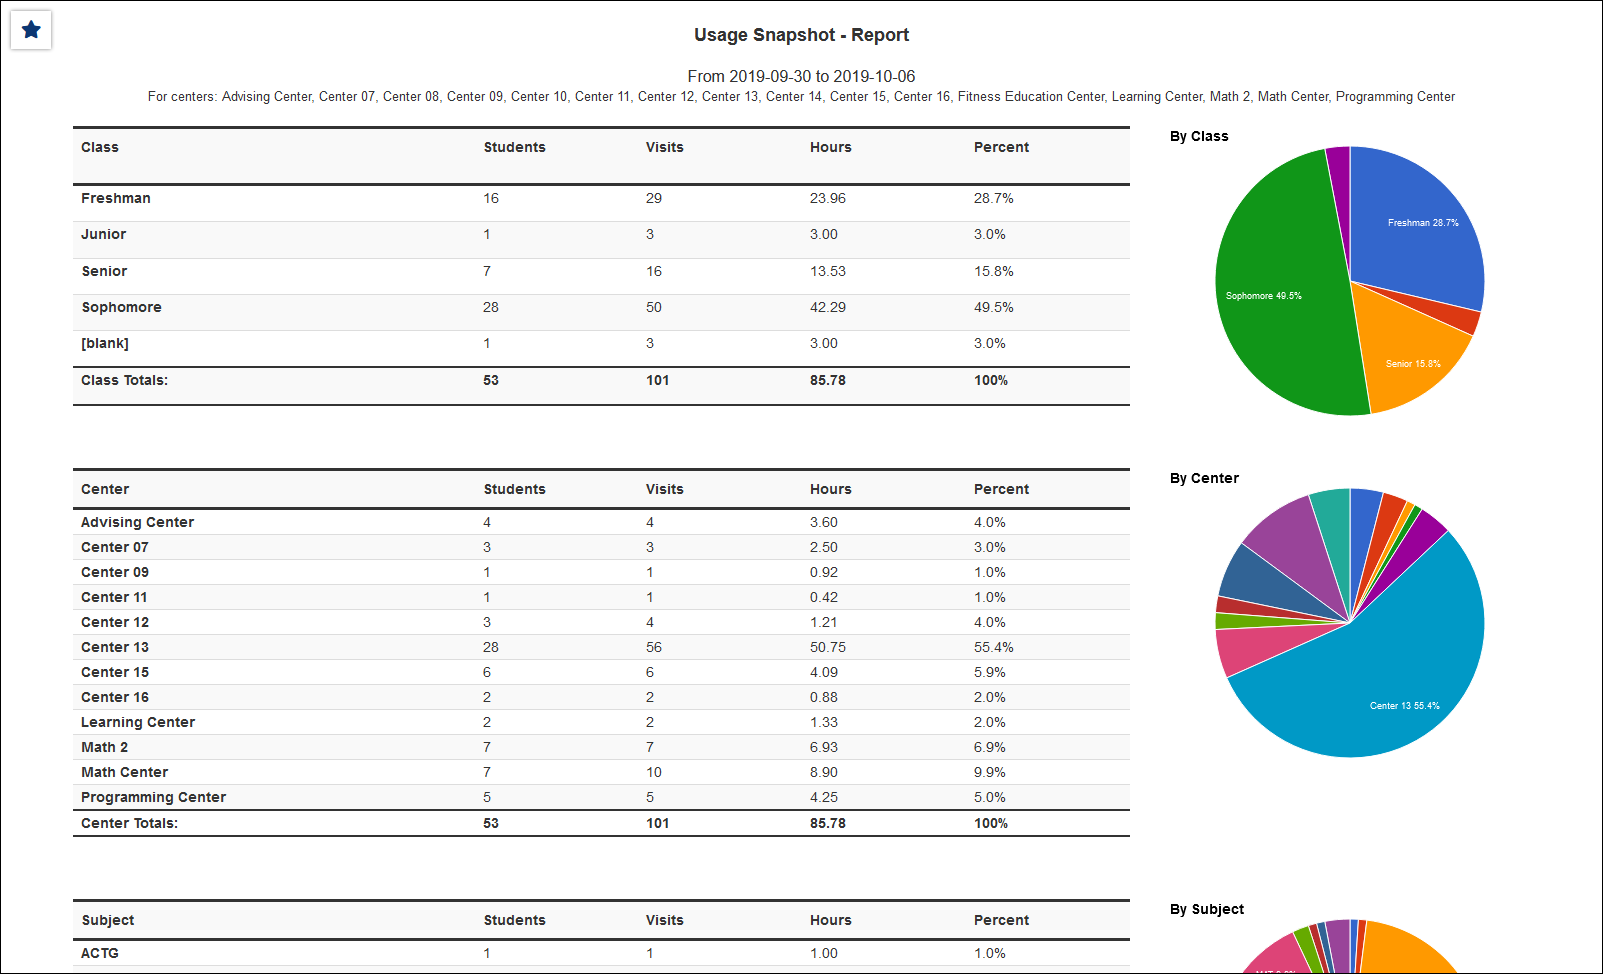
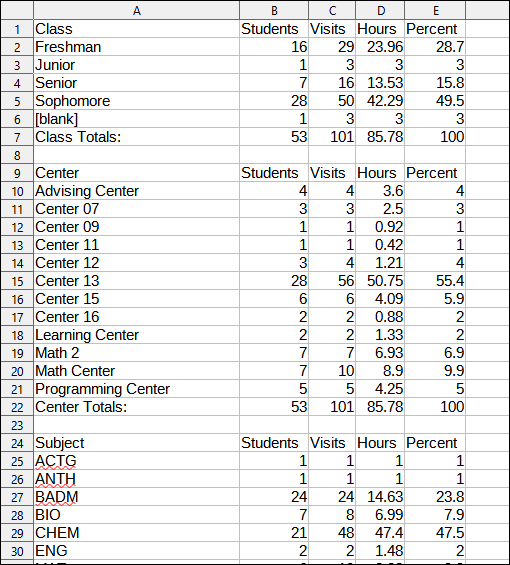
Usage Snapshot This report provides a snapshot of your recent visits by different fields. Each field added will display the name of the fields, number of students, total visits, total hours, and a pie-chart for the data within the specified range. You can also generate this report as a Date Comparison, allowing you to view two columns of snapshot data for different date ranges. CSV Export
|

