TracCloudNews07 and TracCloudNews11: Difference between pages
From Redrock Wiki
(Difference between pages)
TracCloudNews07
No edit summary |
No edit summary |
||
| Line 3: | Line 3: | ||
| style="vertical-align:top; padding:20px 20px 20px 2px;" | | | style="vertical-align:top; padding:20px 20px 20px 2px;" | | ||
{| style="width:100%; vertical-align:top; " | {| style="width:100%; vertical-align:top; " | ||
== | ==Reports== | ||
TracCloud has many reports, with more being added all the time. In this newsletter we will cover a few commonly ran reports, their capabilities and data they provide. How to save favorite reports and how to share reports with your colleagues. Finally, how to automate your favorite reports and have your reports dropped in your inbox on a daily, weekly or monthly basis. | |||
If you’re looking for data, TracCloud has you covered. TracCloud Reports cover student data, Student Visits data, Appointments data, Registration, Demographic information and much more. | |||
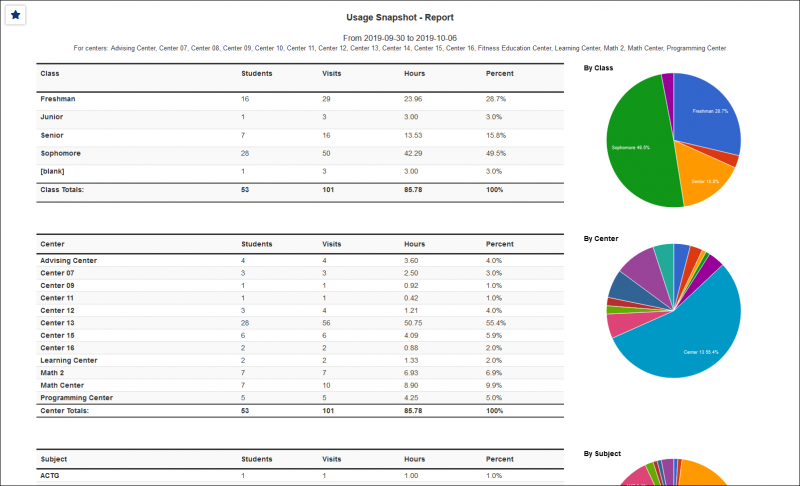
Let’s go over some commonly used reports. First up, a report used often is the usage snapshot report. This report will provide totals, how many students visited, where they visited and who they visited with, along with the option to include demographic information. | |||
The Usage Snapshot report is located under: <i>Reports > Management > Usage Snapshot</i> | |||
The usage Snapshot is two reports in one. In the report settings there are two date ranges and two report options at the bottom: | |||
<b>View Snapshot</b>: Will provide details and data about a single date Range | |||
<b>Date Comparison</b>: Will provide details and data about 2 separate date range. Commonly used to compare data for two semester semesters or two separate years. | |||
[[File:8026557.png|600px]]<br><br> | |||
[[File: | <i>Usage Snapshot:</i><br> | ||
[[File:3881667.png|800px]]<br><br> | |||
<i>Date Comparison, using both Date Range fields:</i><br> | |||
[[File:5867481.png|800px]]<br><br> | |||
Another report and favorite of most users is <i>Visits by ??</i>. This report will provide the details of who met with whom and the times, dates, and the overall durations of those interactions. Overall, this report is very customizable and can provide a significant amount of detailed information. | |||
The Visits By ?? report is located under: <i>Reports > Students > Visits by ??</i> | |||
This reports flexibility comes from 3 settings: | |||
* <b>Group by</b>: Group records by the selected fields. Some reports allow you to add secondary and tertiary groupings as well. | |||
* <b>Additional Search</b>: | |||
::Filter your results by a selected field. | |||
::Use * as a wildcard (Subject: MAT*) | |||
::| as "or" (Major: Mathematics|Biology) | |||
::"#" as "Not" (Status: #Inactive) | |||
::Multiple fields can be added to further narrow down your results. | |||
* <b>Additional fields to show</b>: This can be used to add additional data fields to the report results. For example, you could use this to add a student's email address in a visit report. | |||
Many campuses frequently run this report with their data groups by center or by consultant. However, feel free to try out additional options to see what works best for you. | |||
<b>Visits By ??</b> - Report Grouped By: Center and Consultant<br> | |||
<b>Additional Search</b>: Only show visits if the Visit Reasons contains the Word “Test” - * Is a Wildcard. | |||
[[File:2340609.png|600px]]<br> | |||
[[File:6802275.png|800px]]<br><br> | |||
To find out more about reports, visit our [[TracCloudReports|Report Wiki by clicking here.]]<br> | |||
Also, at the bottom of your report chooser there is link to each Reports wiki: | |||
[[File:1009147.png|700px]]<br><br> | |||
<hr> | |||
{{#lst:TracCloudReports|SavingFavorites}} | |||
<hr> | |||
{{#lst:TracCloudReports|AutomatingReports}} | |||
<hr> | |||
{{NewsletterContactInfo}} | {{NewsletterContactInfo}} | ||
Revision as of 17:26, 24 April 2023
| Template:TracCloudNewslettersTOC |
ReportsTracCloud has many reports, with more being added all the time. In this newsletter we will cover a few commonly ran reports, their capabilities and data they provide. How to save favorite reports and how to share reports with your colleagues. Finally, how to automate your favorite reports and have your reports dropped in your inbox on a daily, weekly or monthly basis. If you’re looking for data, TracCloud has you covered. TracCloud Reports cover student data, Student Visits data, Appointments data, Registration, Demographic information and much more. Let’s go over some commonly used reports. First up, a report used often is the usage snapshot report. This report will provide totals, how many students visited, where they visited and who they visited with, along with the option to include demographic information. The Usage Snapshot report is located under: Reports > Management > Usage Snapshot The usage Snapshot is two reports in one. In the report settings there are two date ranges and two report options at the bottom: View Snapshot: Will provide details and data about a single date Range Date Comparison: Will provide details and data about 2 separate date range. Commonly used to compare data for two semester semesters or two separate years. Date Comparison, using both Date Range fields: Another report and favorite of most users is Visits by ??. This report will provide the details of who met with whom and the times, dates, and the overall durations of those interactions. Overall, this report is very customizable and can provide a significant amount of detailed information. The Visits By ?? report is located under: Reports > Students > Visits by ?? This reports flexibility comes from 3 settings:
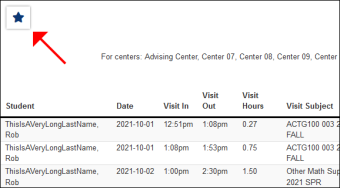
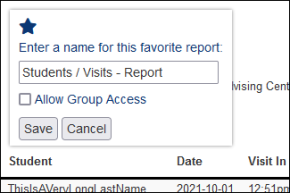
Many campuses frequently run this report with their data groups by center or by consultant. However, feel free to try out additional options to see what works best for you. Visits By ?? - Report Grouped By: Center and Consultant To find out more about reports, visit our Report Wiki by clicking here. Saving a Report as a FavoriteFind a report that you plan on coming back to? Save it as a favorite for quick access later. From the report results window itself, click the star icon in the top-left corner, choose a name for your favorite, and click save.
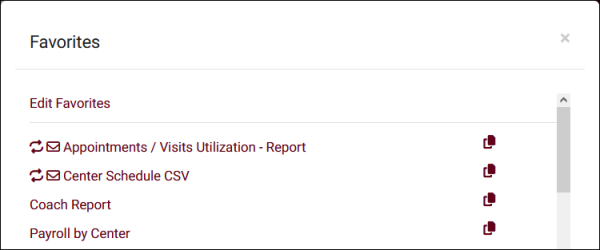
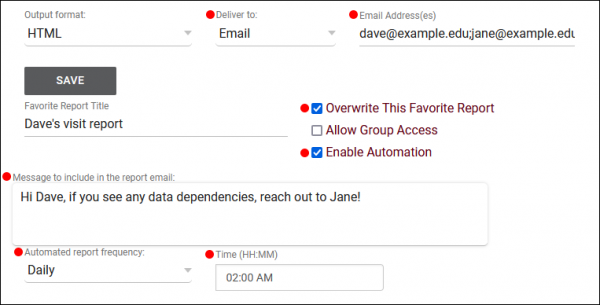
This report can then be found from your dashboard under Reports > Favorites at any time. The button can be used to duplicate the favorite report. Automating a Favorite ReportAfter saving your report as a favorite, you can automate it to run on a set schedule and be emailed to you or a group of users. Start by going to Reports > Favorites > Edit Favorites. This will bring you to the following screen. Click on the Pencil icon of the report you want to automate.
Click save to apply your changes. More Questions? |
