|
|
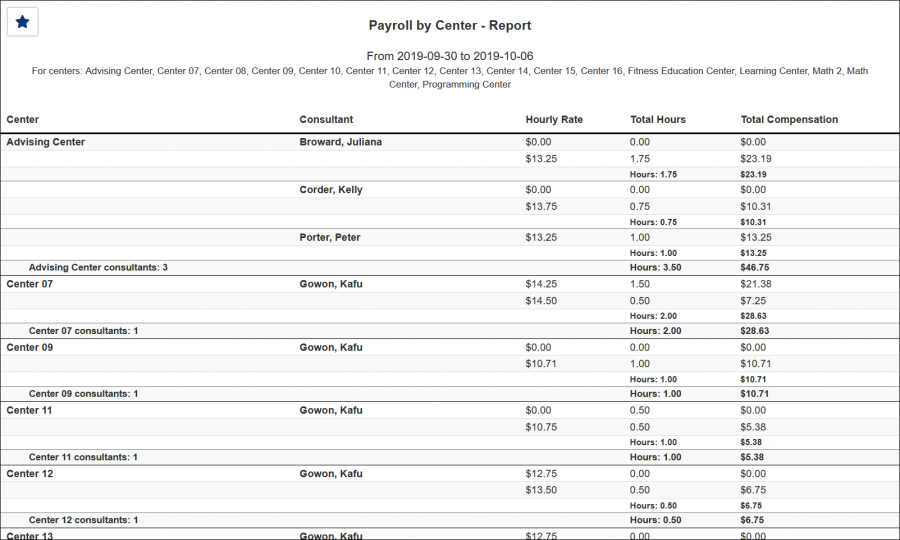
Payroll
This report will show you payroll grouped by the center. Consultant, hourly rate, total hours, and total compensation will be displayed.
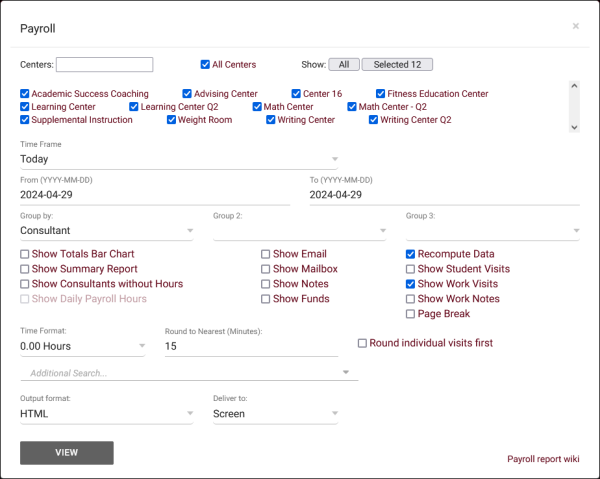
- Filter report data by center. You can select all centers or only a specific few to narrow down your results. At least one center must be selected.
- The date range for the data in this report. Beyond entering a date range manually, you can also choose a preset date range (Today, This Month, This Semester, etc) from the dropdown list above.
- Group records by the selected field. Some reports allow you to add secondary and tertiary groupings as well.
- Adds a visual bar chart of totals to your report data.
- Show Email, Mailbox, Notes
- Additional consultant fields that can be included in report results if needed.
- This will recalculate your consultant work times to retrieve the most up to date information, but can slightly slow down processing time.
- Only show data totals, excluding details of individual records.
- Include Student Visit data in report results, to view who the consultant was working with during their work hours.
- Show Consultants without Hours
- Display all consultants in payroll report, those without work time will simply display as having 0.00 hours.
- Include data on the individual visits in the report itself. If enabled, you will also be able to include notes from the work visit record in the report results by checking Show Work Notes.
- Shows a day-by-day breakdown of work hours within the overall date range that you selected.
- Include fund source in results.
- Separate consultants onto different pages when printing the HTML version of this report. Requires 'Group by' options to be unchecked.
- This determines the format of duration, a 90-minute session could display as 1.50, 01:30:00, or 01:30.
- Round to Nearest & Round individual visits first
- Round total visit time to the nearest X-minutes. You also have the ability to round individual visit durations first.
- Filter your results by a selected field.
Use * as a wildcard (Subject: MAT*)
| as "or" (Major: Mathematics|Biology)
# as "Not" (Status: #Inactive)
&& as "And" (Major: #Mathematics&&#Biology)
blankornull as a keyword to find records where the field is blank (Reason: blankornull)
Multiple fields can be added to further narrow down your results.
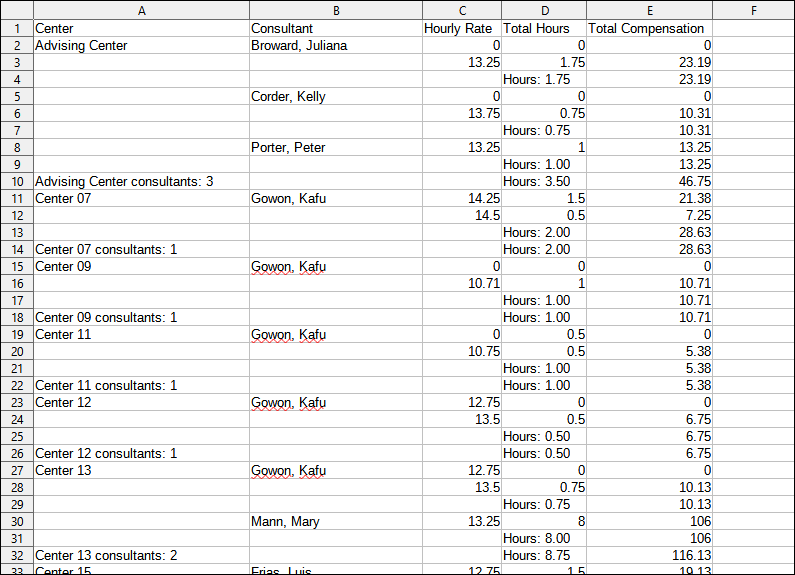
- Use HTML to view report data in your browser, or export this report to a CSV file (available for most reports). Some reports offer additional CSV options depending on if you want to include totals and/or data grouping in your export.
- Display this report immediately in your browser ("Screen"), or send the report to a specified email address ("Email"). Multiple email addresses can be specified, use ; to separate them (example@example.edu;sample@example.edu).
HTML
CSV
|


