TracCloudReportsManagement14 and TracCloudReportsManagement13: Difference between pages
From Redrock Wiki
(Difference between pages)
No edit summary |
No edit summary |
||
| Line 4: | Line 4: | ||
| style="vertical-align:top; padding:20px 20px 20px 2px;" | | | style="vertical-align:top; padding:20px 20px 20px 2px;" | | ||
{| style="width:100%; vertical-align:top; " | {| style="width:100%; vertical-align:top; " | ||
<b><big> | <b><big>Usage Snapshot</big></b><hr> | ||
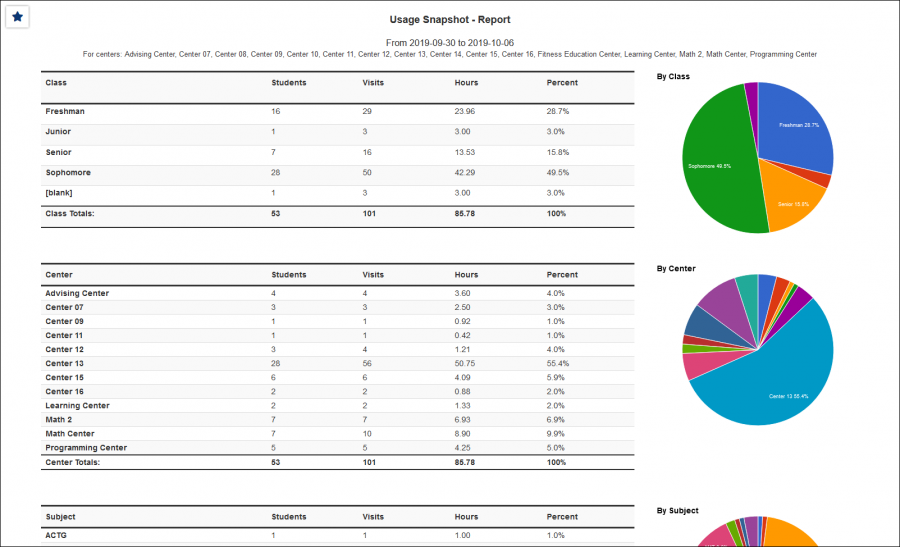
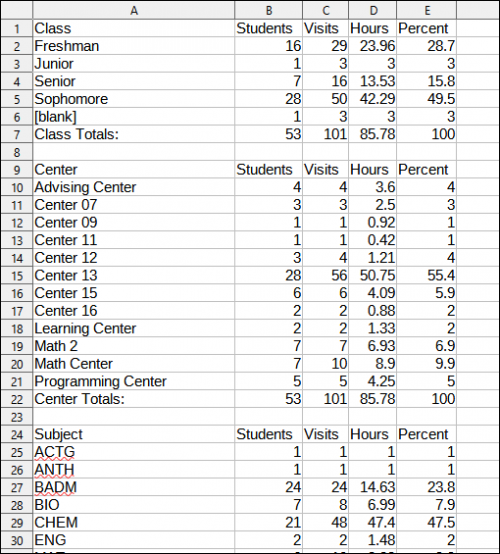
This report | This report provides a snapshot of your recent visits by different fields. Each field added will display the name of the fields, number of students, total visits, total hours, and a pie-chart for the data within the specified range. You can also generate this report as a <i>Date Comparison</i>, allowing you to view two columns of snapshot data for different date ranges.<br><br> | ||
[[File: | [[File:8026557.png|600px]]<br> | ||
{{#lst:Template:TracCloudReportsDescriptions|Centers}} | {{#lst:Template:TracCloudReportsDescriptions|Centers}} | ||
| Line 14: | Line 14: | ||
{{#lst:Template:TracCloudReportsDescriptions|TimeFrame}} | {{#lst:Template:TracCloudReportsDescriptions|TimeFrame}} | ||
{{#lst:Template:TracCloudReportsDescriptions| | {{#lst:Template:TracCloudReportsDescriptions|SecondTimeFrame}} | ||
{{#lst:Template:TracCloudReportsDescriptions| | {{#lst:Template:TracCloudReportsDescriptions|InPersonOnline}} | ||
{{#lst:Template:TracCloudReportsDescriptions| | {{#lst:Template:TracCloudReportsDescriptions|ShowOnlineSpecifically}} | ||
{{#lst:Template:TracCloudReportsDescriptions|AdditionalSearch}} | {{#lst:Template:TracCloudReportsDescriptions|AdditionalSearch}} | ||
{{#lst:Template:TracCloudReportsDescriptions| | {{#lst:Template:TracCloudReportsDescriptions|FieldsToShow_UsageSnapshot}} | ||
{{#lst:Template:TracCloudReportsDescriptions|OutputFormat}} | |||
{{#lst:Template:TracCloudReportsDescriptions|DeliverTo}} | {{#lst:Template:TracCloudReportsDescriptions|DeliverTo}} | ||
{{#lst:Template:TracCloudReportsDescriptions|ViewBy_UsageSnapshot}} | |||
<hr> | <hr> | ||
<b><big>HTML</b></big><br> | |||
: | [[File:3881667.png|900px]] | ||
<br><br> | |||
<b><big>CSV</b></big><br> | |||
[[File:2240114.png|500px]] | |||
|} | |} | ||
[[Category:TracCloud]] | [[Category:TracCloud]] | ||
Revision as of 17:03, 24 April 2023
Management
• Appointment Slot Utilization Date Comparison • Appointments/Availabilities by Hour by Day of Week • Appointments/Visits Utilization • Consultant Max Hours and Non-Duplicated Appointment Time • Consultant Non-Duplicated Visit Time • Logins by Hour by Day of Week • Optional: In-Person vs Online Appointments • Outstanding Appointment Requests • Students Visits Cleanup Data • Visits by Faculty and Subject • Visits by Assigned Advisor and Student
|
Usage Snapshot This report provides a snapshot of your recent visits by different fields. Each field added will display the name of the fields, number of students, total visits, total hours, and a pie-chart for the data within the specified range. You can also generate this report as a Date Comparison, allowing you to view two columns of snapshot data for different date ranges.
|

