|
|
Q2 Visits by ??
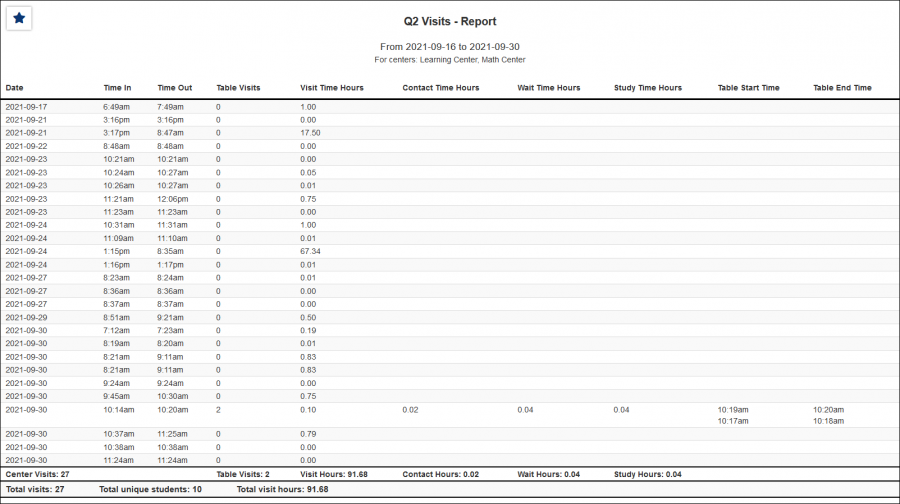
This report provides an overview of visits that took place in your center, along with the contact time(s) for each center visit.
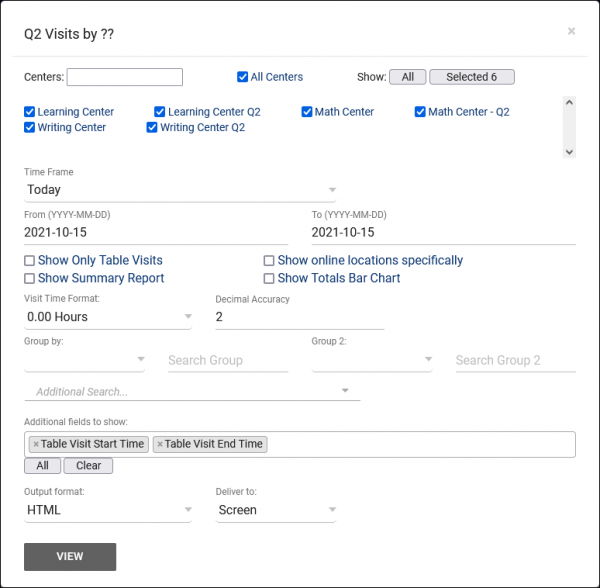
- Filter report data by center. You can select all centers or only a specific few to narrow down your results. At least one center must be selected.
- The date range for the data in this report. Beyond entering a date range manually, you can also choose a preset date range (Today, This Month, This Semester, etc) from the dropdown list above.
- Only show Q2 Table visits specifically, exclude center visit records.
- Only show data totals, excluding details of individual records.
- Show online locations specifically
- If unchecked, the 'Location' for online Appts/Visits will be displayed as simply 'Online.' If this option is checked, it will display the specific online location (e.g., 'https://zoom.us/123456789').
- Adds a visual bar chart of totals to your report data.
- This determines the format of duration, a 90-minute session could display as 1.50, 01:30:00, or 01:30.
- This determines the decimal accuracy of duration data. Defaults to 2, showing a 1-hour session as "1.00".
- Group records by the selected field. Some reports allow you to add secondary and tertiary groupings as well.
- Filter results based on your search in this group. For example, if you're grouping by Student Major, you can put 'Mathematics' in this field to only show students assigned to that Major.
- Filter your results by a selected field.
Use * as a wildcard (Subject: MAT*)
| as "or" (Major: Mathematics|Biology)
# as "Not" (Status: #Inactive)
&& as "And" (Major: #Mathematics&&#Biology)
blankornull as a keyword to find records where the field is blank (Reason: blankornull)
Multiple fields can be added to further narrow down your results.
- Additional fields to show
- This can be used to add additional data fields to the report results. For example, you could use this to add a student's email address in a visit report.
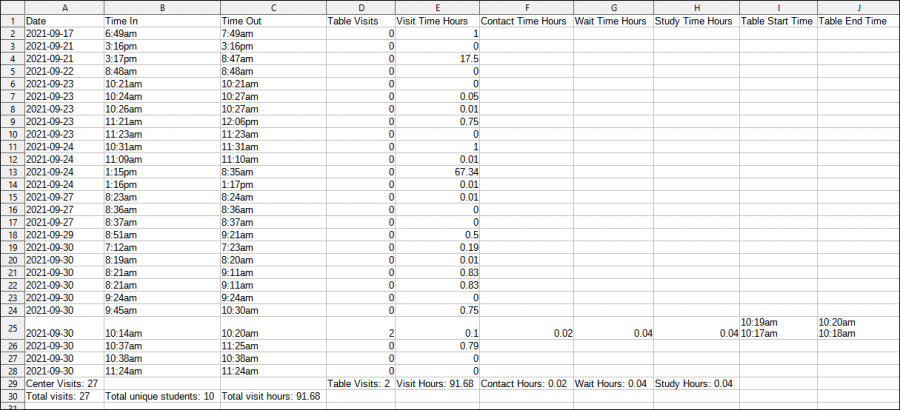
- Use HTML to view report data in your browser, or export this report to a CSV file (available for most reports). Some reports offer additional CSV options depending on if you want to include totals and/or data grouping in your export.
- Display this report immediately in your browser ("Screen"), or send the report to a specified email address ("Email"). Multiple email addresses can be specified, use ; to separate them (example@example.edu;sample@example.edu).
HTML
CSV
|


