Q2

From Redrock Wiki

The printable version is no longer supported and may have rendering errors. Please update your browser bookmarks and please use the default browser print function instead.

    The legacy Trac 4.0 version of TutorTrac/AdvisorTrac/FitnessTrac is no longer receiving updates and will be end-of-life in 2025. Click here to schedule a TracCloud demo or reach out to sales@go-redrock.com for migration pricing or contract details.


New, easy to use interface
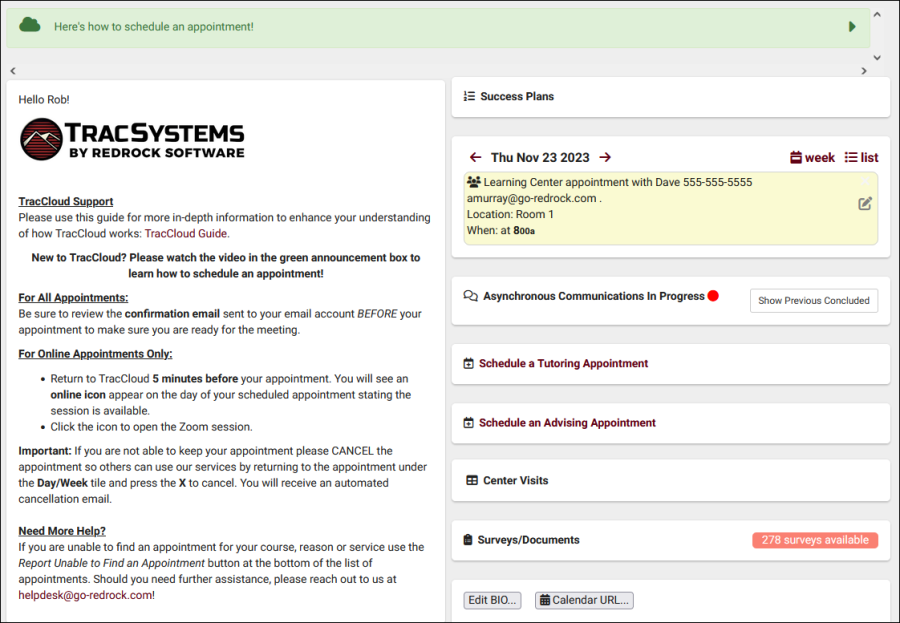
TracCloud features a modern, easy to use, and mobile-friendly interface, allowing you to easily find and manage your data as you need. Students, staff, and faculty will have a much easier time navigating through the system and accessing the data they need. The new dashboard offers many easy to access widgets to view and manage your data.

7018287.png

New Features
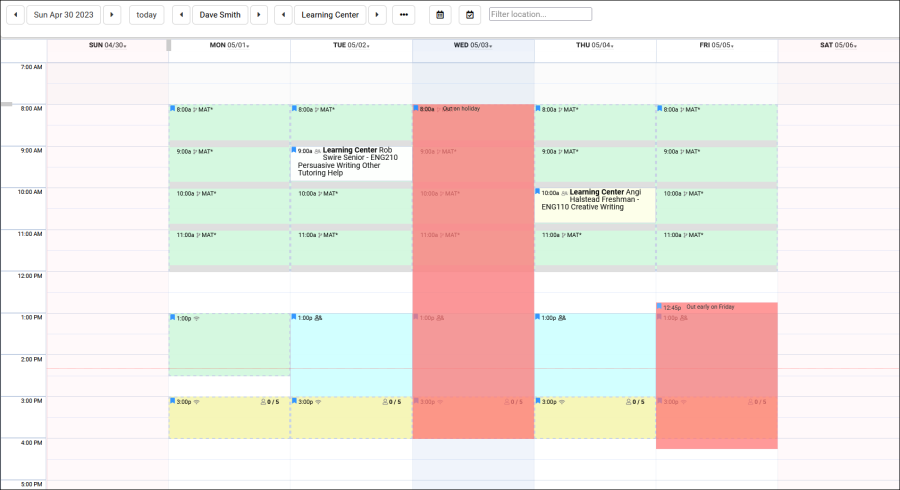
Export almost any report into Excel. Static and dynamic QR codes for touchless-kiosk environments. Unlimited custom data fields in student records, visits, appointments, and more. Customizable views of listing pages. Student timelines. Twig and HTML-supported emails and system messages. Customizable log listing and kiosk views. Center descriptions. New reports. Student success plans as a new module, along with work plans for staff. The full list of changes couldn't fit in this article, and more is being added all the time. Relating to the schedule specifically, you'll find a new appointments listing, availability badges, custom search appointment links and QR codes, unlimited customizable max appointment rules, asynchronous appointment support, and more.

4062955.png

Customizable
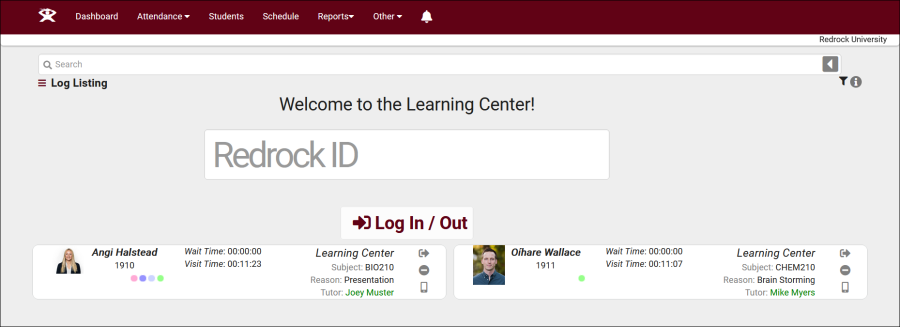
With Twig support, you can personalize system messages, upcoming appointment lists, emails, and more based on the users who are viewing/receiving them. From simple changes like greeting the user by name to completely changing an email based on if the related appointment was in-person or online, in a certain center, for a certain reason, even if a certain custom field in the student's profile has a specific value. This extends to the log listing and kiosks as well, where you can add or remove fields, rearrange the data that's displayed, and add custom formatting with HTML and Twig.

1670850.png

Faster
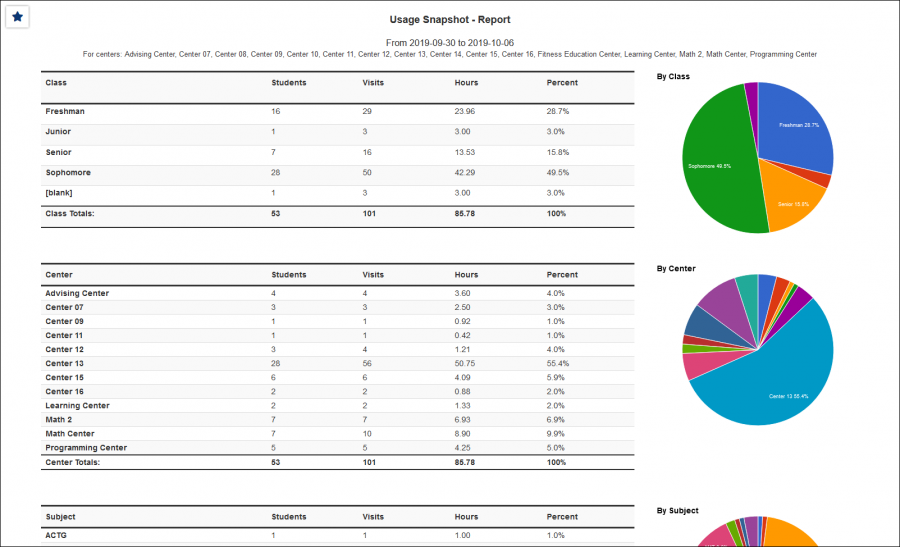
Rewritten from the ground up hosted on AWS, using a MySQL database, TracCloud is faster in every way. This performance increase compared to Trac 4.0 can be noticed throughout the entire system, with reports being especially improved. Even the biggest reports in TracCloud load within a few seconds.

3881667.png

Migrate Existing Data
Migrate your existing data from Trac 4.0, allowing you to pick up right where you left off. We'll work with you to plan out your migration, coordinating with your IT, and training your system administrators to get you started in TracCloud.

7254776.png

Click here to schedule a TracCloud demo!


Q2 Tables is a redesign of a log in and out system, specifically for study table centers where students work on their own, but can request assistance as needed. No need to have students raise their hand, flag, or use another device to notify that they need some help – it is completely digital and web-based. Smartphones and tablets drive the queuing system for students that need assistance and for consultants to see the queue and record contacts with students.

Q2 Terminology

Q2 introduces some new concepts and terminology to the traditional Trac system.

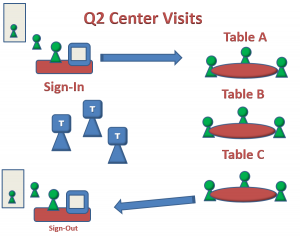
  • Q2 Center Queue – Any Q2 enabled Center is where students arrive and work dynamically spending time working independently and/or requesting help from Consultants one or multiple times for one or multiple subjects. Think of this as the “Primary Center” or “Main Center”.
  • Table List – The center will have designated tables or rooms for the students, when the student requests help, they select the table or room they’re at for the tutor to easily locate the student.

4g54g54wg.png


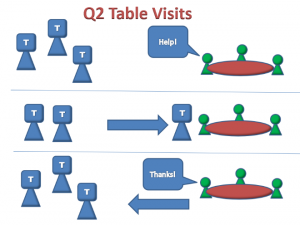
  • Q2 Center Visits – A single recorded interaction between a Consultant and Student. A student might have multiple Table Visits during a single visit to a Q2 enabled Center. Commonly referred as “Table Visits”, “Sessions”, “Study Tables”, “Q2 Tables”.

R76jr64.png 242g353.png


  • Q2 Config – A pair of Q2 enabled Centers. “Center Visit” and “Table Visits”.


Students' View

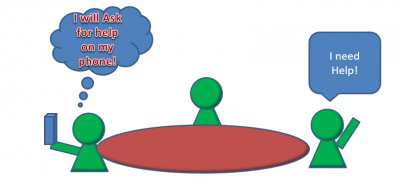
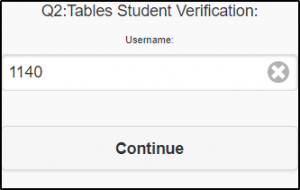
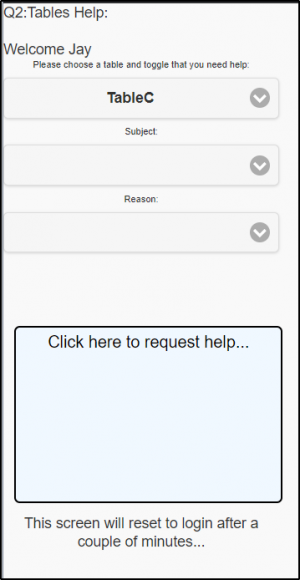
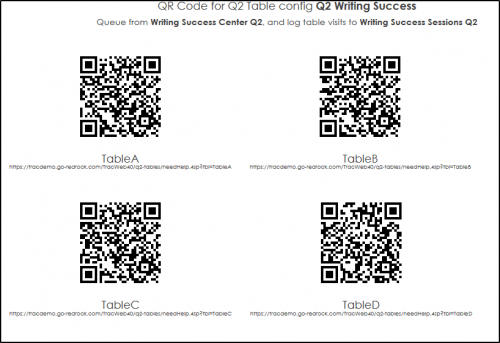
The student would access the Q2 raise-hand page via phone, tablet or computer. If they’re accessing this via their personal device, they can be emailed a link as they login or they can scan a QR code.

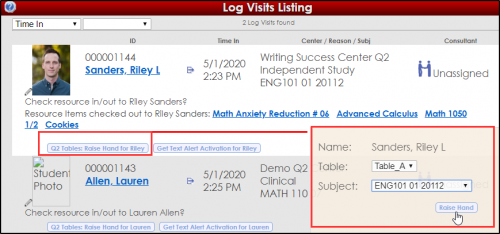
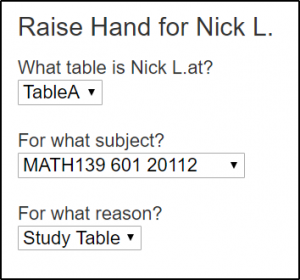
From this view, the student can virtually raise their hand to get help with a specified subject/reason.

68j6n7.png 099ll8y.png


Consultants' View

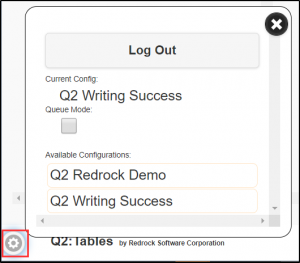
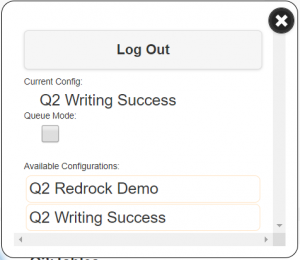
Consultants would login via a specified link, once logged in, they will be brought to a screen where they can click a gear icon to select their config.


Ghftrk64.png


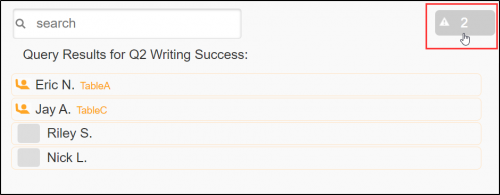
The “Queue Mode” allows staff to display all the students that are waiting to get help. Many campuses use this mode to show the list of students on a TV screen or Tablet in the center.

H455545.png

35h564j57.png


The “Available Configurations” will be listed for the consultant and they will be based on the consultants’ group settings.

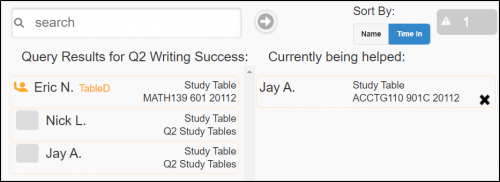
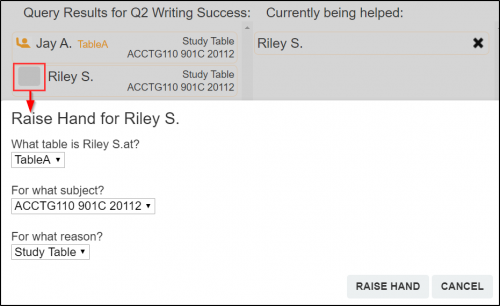
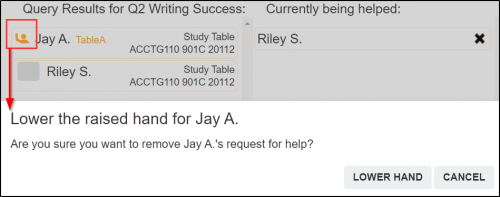
On the left side, you will see all the students that are signed in the Center and any students that have raised their hand to receive help. Click on the grey square to raise the student’s hand, click on the orange icon to lower it.

On the right side, they can see the student they’re currently helping

65jh5j746k.png

Nfgnmgmg.png


Front Desk Staff

45rtfgfgjgf.png


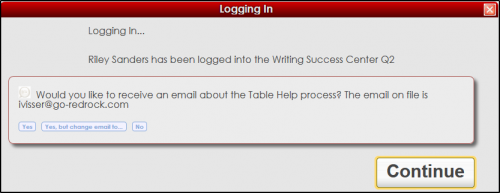
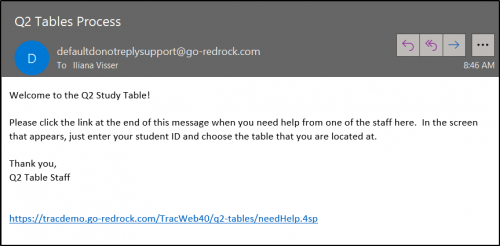
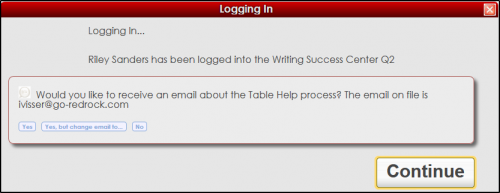
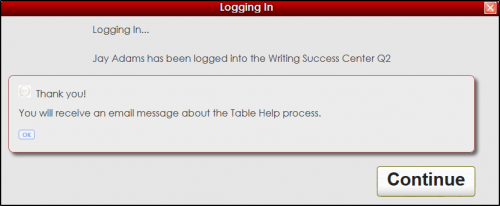
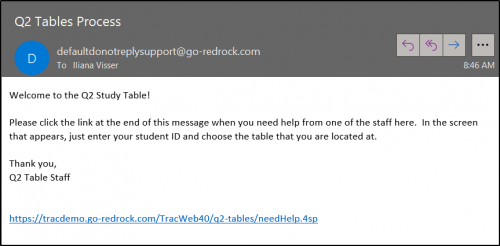
When logging a student into the Q2 center, it will prompt you to send an email with the raise hand feature to their Trac System email address, or a manually entered address.

Fgk56k5k6.png


Once received, the email will look like this:

6j4646j4j6f.png


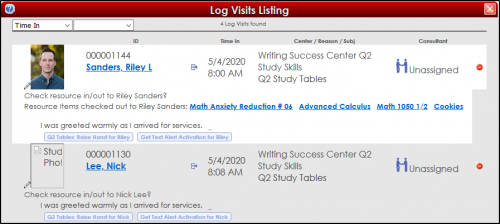
Next, you would “Raise” the Students hand. This example is to show how admins and front desk staff can assist a student if the student has a question.

Vbcmvmv.png

Xbmbmb.png


Admin

Myvbmr.png


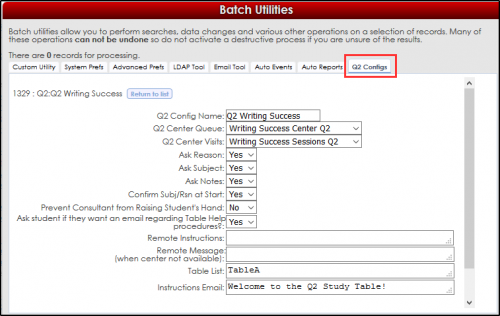
  • Q2 Config Name – Displays in the “Available Configs” for Consultants.


Hrmrtr.png


  • Q2 Center Queue – is the Main Center.
  • Q2 Center Visits – is the Table Center.
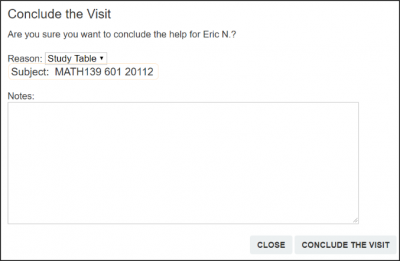
  • Ask Reason – Display the reason option a student hand is raised and when the consultants conclude the table visit.
  • Ask Subject – Display the subjects when a student hand is raised and when the consultants conclude the table visit.
  • Ask Notes – Display the “Notes” box when the consultants start the table visit and conclude the table visit.

Yfnggfngfn.png Ryjrrnrtrt.png


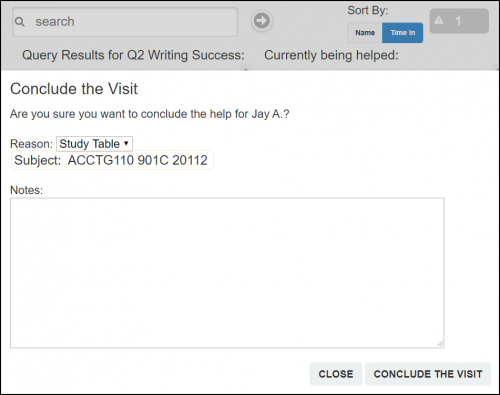
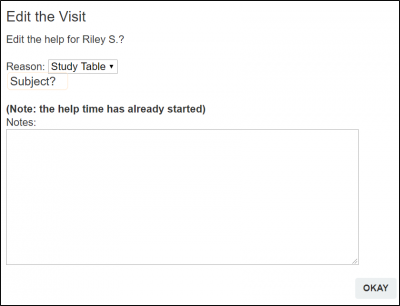
  • Confirm Subj/Rsn at Start – When the consultant starts a table visit, a window can display that allows the consultants to edit the Subject/Reasons and add notes.

Nvnfgfgnnfg.png


  • Prevent Consultant from Raising Student's Hand – This will remove the option for a consultant to raise or lower a student’s hand when they ask for help.

Te5rbrtbtr.png

Vfgnfngfng.png


  • Ask student if they want an email regarding Table Help procedures? – During the primary center login process, this enabled or disables the Table Help email prompt. If enabled, the student will be asked if the email on file is correct, if they want to manually enter a new email, or if they don’t want to receive anything. This will show up for students logging in on a Kiosk and when front desk staff members log them in.


Vmcmvmbrtm.png

Erbmghndd.png


  • Table List – You can enter all the Table numbers, or Table Location that helps consultants identify where the student is located. The Table will display when a student hand is being raised.

Spaces cannot be included in the name of the table, as the table name is included in the URL. Underscores_are_fine.

Nnvcfgft.png


  • Instructions Email – This is where you can edit the email that is sent to the students when the students log in at the Kiosk, or if a front desk or admin signs them into the Main Center and opts to get an email about the Table help Process.

This requires the setting “Ask student if they want an email regarding Table Help procedures?” to be enabled.

Vbnntyymn.png


Reports


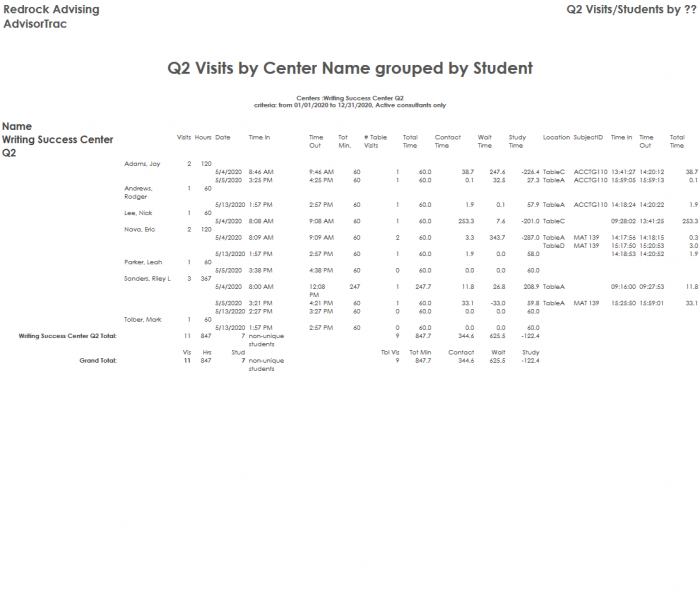
The Q2 Visits/Students by ?? Report will show you all the visits for your center and all the tables visits that have been recorded when the consultants helps a student when they raise their hand.

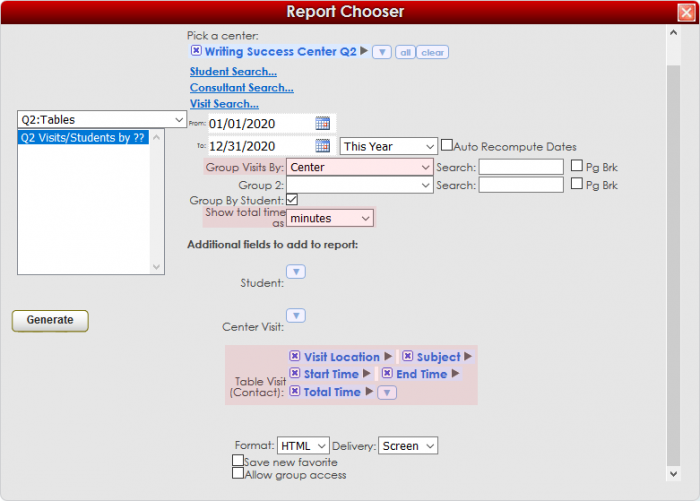
GENERATE THE REPORT


To generate the Q2 Visits/Students by ?? Report, click on Reports from the TutorTrac Main Menu. On the Reports Chooser, select Q2:Tables from the pull down list of available categories. After selecting Q2:Tables, choose Q2 Visits/Students by ??. Enter a date range for the time period that you would like to review in the report. Then click on the Generate Report button.


Q2new2.png


Q2new22.png