|
|
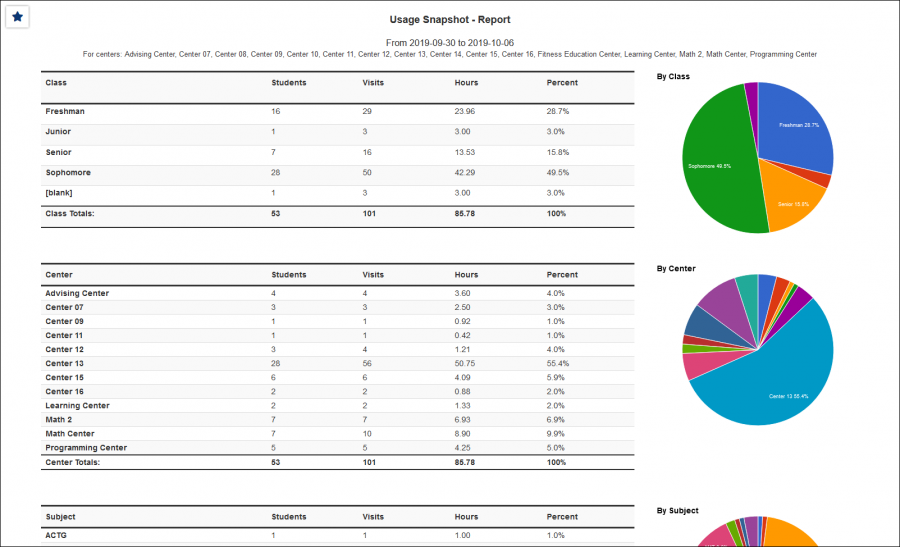
Usage Snapshot
This report provides a snapshot of your recent visits by different fields. Each field added will display the name of the fields, number of students, total visits, total hours, and a pie-chart for the data within the specified range. You can also generate this report as a Date Comparison, allowing you to view two columns of snapshot data for different date ranges.
File:8026557.png
- Filter report data by center. You can select all centers or only a specific few to narrow down your results. At least one center must be selected.
- The date range for the data in this report. Beyond entering a date range manually, you can also choose a preset date range (Today, This Month, This Semester, etc) from the dropdown list above.
- An additional date range for data comparison.
- Filter the data in this report to only include In-Person or Online records. Defaults to All.
- Show online locations specifically
- If unchecked, the 'Location' for online Appts/Visits will be displayed as simply 'Online.' If this option is checked, it will display the specific online location (e.g., 'https://zoom.us/123456789').
- Filter your results by a selected field.
Use * as a wildcard (Subject: MAT*)
| as "or" (Major: Mathematics|Biology)
# as "Not" (Status: #Inactive)
&& as "And" (Major: #Mathematics&&#Biology)
blankornull as a keyword to find records where the field is blank (Reason: blankornull)
Multiple fields can be added to further narrow down your results.
- Use this to add fields to your report. Add Location to see location usage, consultants to see who has met with the most students, etc.
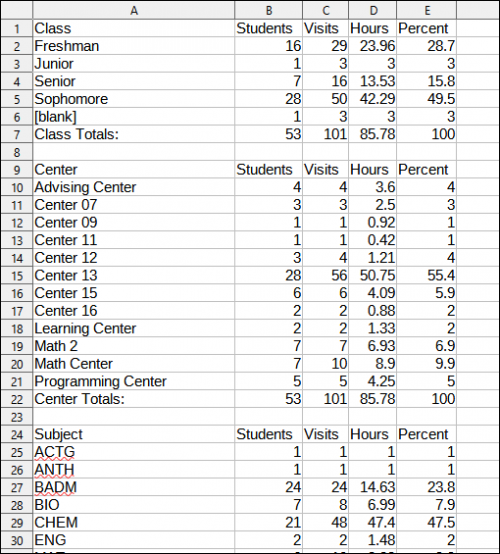
- Use HTML to view report data in your browser, or export this report to a CSV file (available for most reports). Some reports offer additional CSV options depending on if you want to include totals and/or data grouping in your export.
- Display this report immediately in your browser ("Screen"), or send the report to a specified email address ("Email"). Multiple email addresses can be specified, use ; to separate them (example@example.edu;sample@example.edu).
- Usage Snapshot will display visit data for all Snapshot Fields in the date range specified and includes a pie chart view for each field. Date Comparison does the same, but for both of your selected date ranges, allowing to compare traffic from two periods in a single report.
HTML
CSV
|

